Troubleshoot universe issues
YugabyteDB Anywhere allows you to monitor and troubleshoot issues that arise from universes.
Use metrics
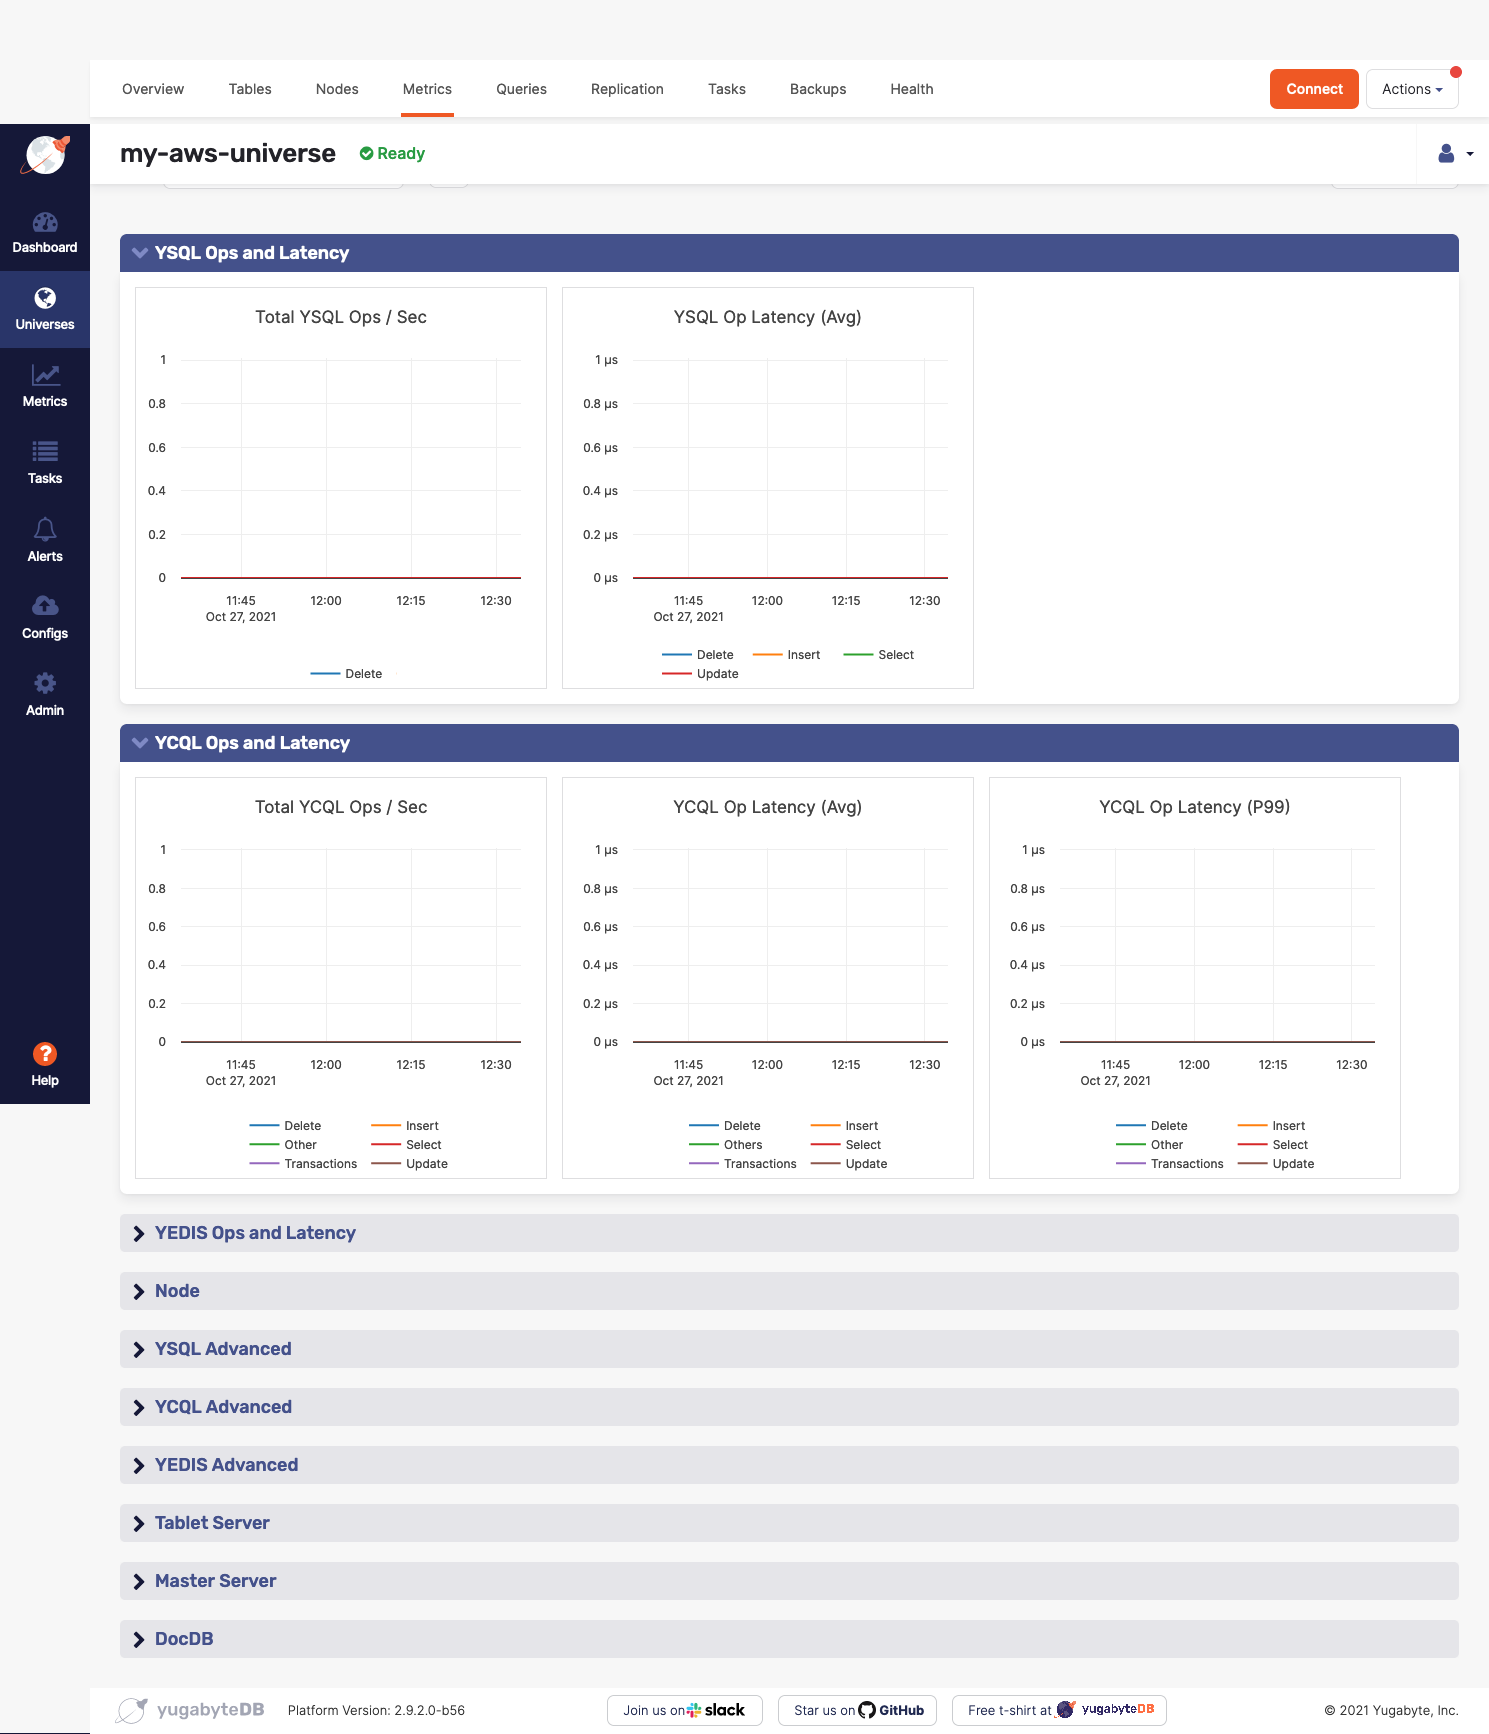
A universe's Metrics page displays graphs representing information on operations, latency, and other parameters accumulated over time for each type of node and server. Examining specific metrics allows you to diagnose and troubleshoot issues.
You access metrics by navigating to Universes > Universe-Name > Metrics, as shown in the following illustration:
You should do the following on a regular basis:
- Monitor remote bootstrap for node failures. You can access this metric via Tablet Server > Remote Bootstraps and Tablet Server > RPC Queue Size.
- Monitor the NTP server to ensure that it is running. You can access this information via your computer's operating system.
- Monitor clock skew so you can see when the clock is off by more than 500 milliseconds. You can access this metric via Node > Clock Skew.
- Monitor your disk usage. The default is 80% used, but you should consider this metric in the context of your environment. For example, the usage percentage can be higher on larger disks; some file systems issue an alert at 75% usage due to performance degradation. You can access this metric via your computer's operating system.
- Monitor YSQL and YCQL operations latency and tune it according to your application service level agreement. You can access this metric via YSQL Ops and Latency, YCQL Ops and Latency, YSQL Advanced, and YCQL Advanced.
- Monitor average read and write latency so you know when latency starts to degrade, at which point you should tune it according to averages. You can access this metric via Tablet Server > Average Latency.
- Monitor reactor delays to measure bottleneck of incoming requests. You can access this metric via Tablet Server > Reactor Delays.
- Monitor log statistics per node to measure churn in the log cache size to determine high rate of evictions. You can access this metric via Tablet Server > WAL Stats / Node.
- Monitor the tablet and master servers' RPC queue size so you can see all the subelements and know if there is a bottleneck that might cause performance degradation. You can access this metric via Tablet Server > RPC Queue Size and Master Server > RPC Queue Size.
- Monitor DocDB cache miss ratio so you can tune the cache when necessary. You can access this metric via DocDB > Cache Hit & Miss.
The following tables describe metrics available via the YugabyteDB Anywhere UI.
YSQL ops and latency
| Graph | Description | Alert Guidance | Example |
|---|---|---|---|
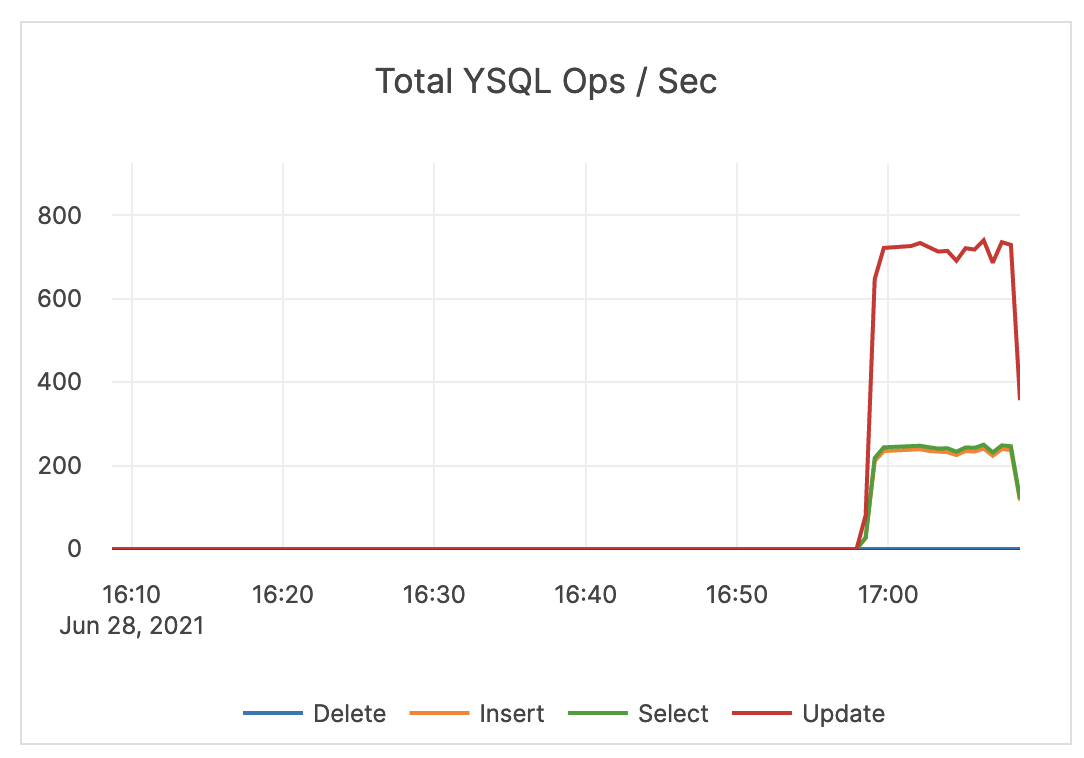
| Total YSQL Ops / Sec | The count of DELETE, INSERT, SELECT, and UPDATE statements through the YSQL API. This does not include index writes. |
An alert should be issued if count drops significantly lower than your average count, as this might indicate an application connection failure. In addition, an alert should be issued if the count is much higher than your average count, as this could indicate a DDoS, security incident, and so on. It is recommended to coordinate this with the application team because there could be legitimate reasons for dips and spikes. |
 |
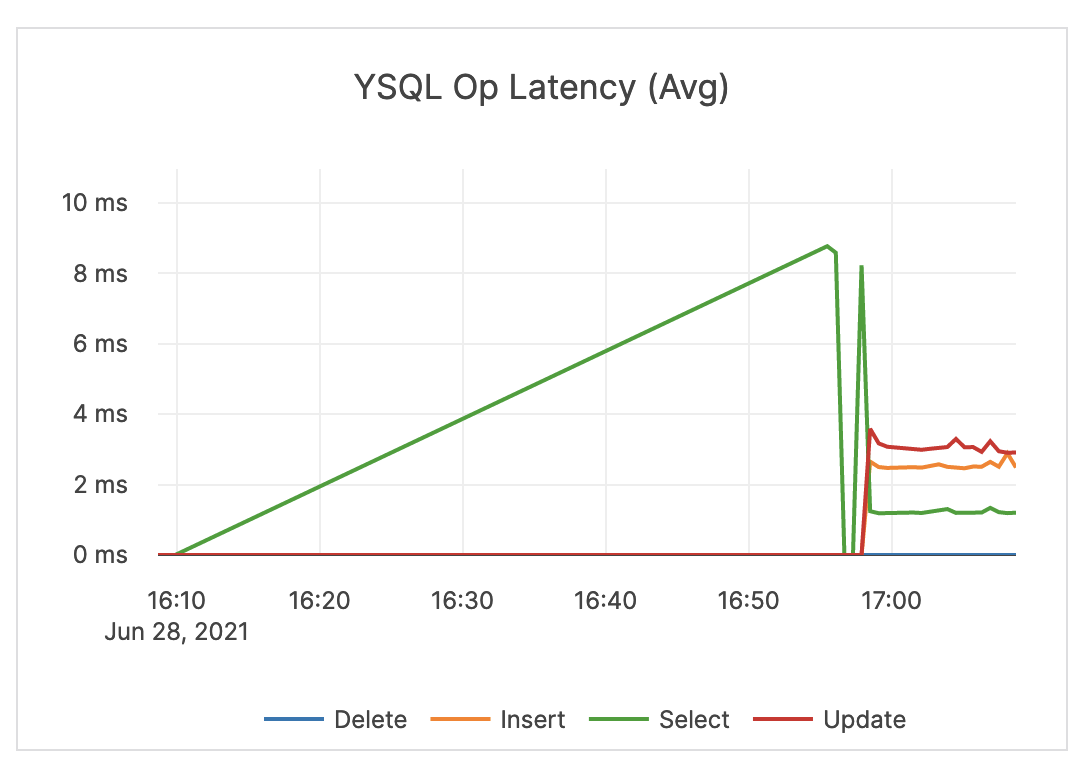
| YSQL Op Latency (Avg) | Average time (in milliseconds) of DELETE, INSERT, SELECT, and UPDATE statements through the YSQL API. | An alert should be issued when the overall latency is close to or higher than your application SLA. Note that the overall latency metric is less helpful for troubleshooting specific queries. It is recommended that the application track query latency. Also note that there could be reasons your traffic experiences spikes in latency. For example, ad-hoc queries such as count(*) are executed. |
 |
YCQL ops and latency
| Graph | Description | Alert Guidance | Example |
|---|---|---|---|
| Total YCQL Ops / Sec | The count of DELETE, INSERT, SELECT, and UPDATE transactions, as well as other statements through the YCQL API. | An alert should be issued if count drops significantly lower than your average count, as this could indicate an application connection failure. | 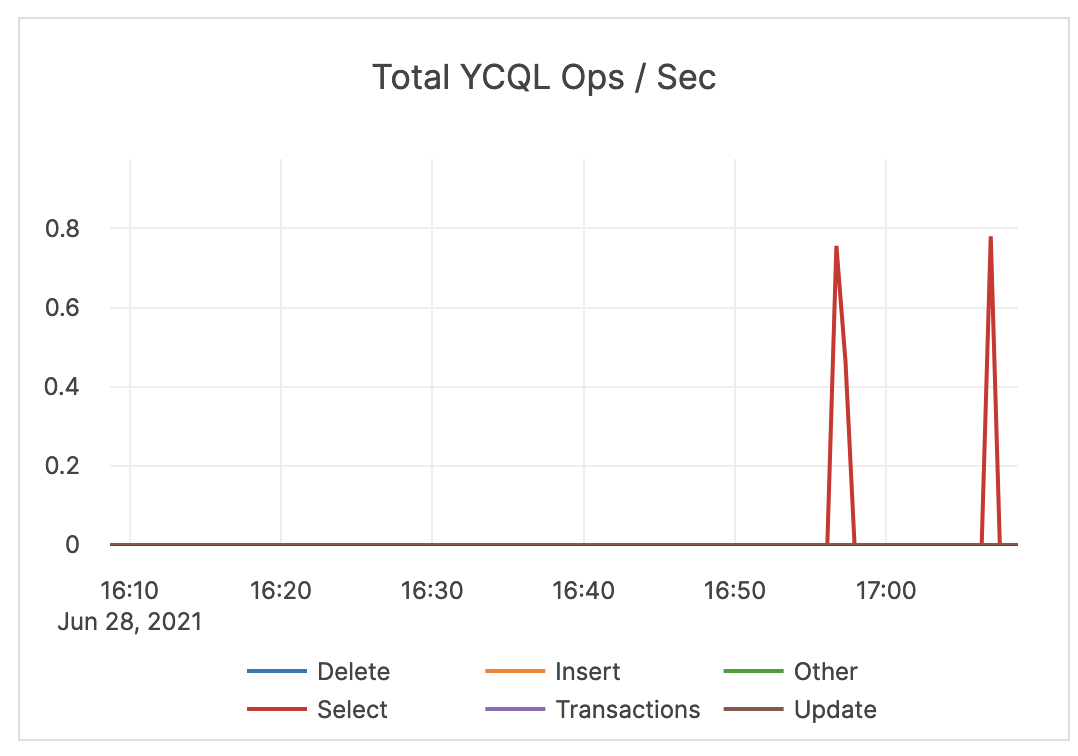 |
| YCQL Op Latency (Avg) | The average time (in milliseconds) of DELETE, INSERT, SELECT, and UPDATE transactions, as well as other statements through the YCQL API. | An alert should be issued when latency is close to or higher than your application SLA. | 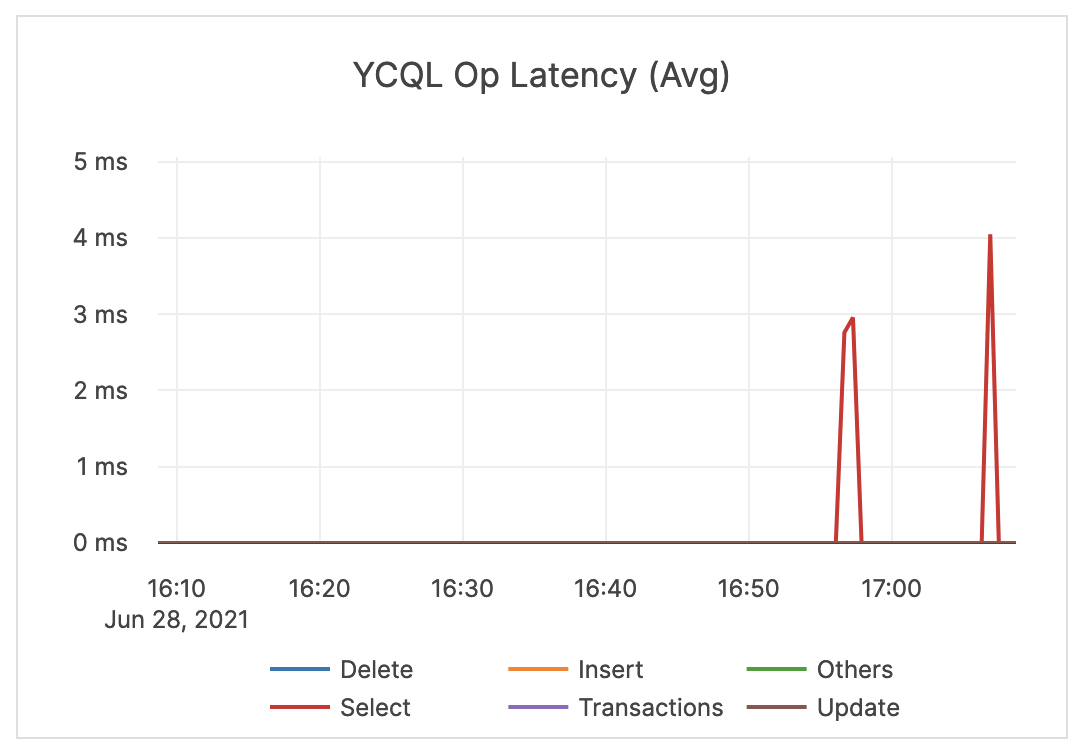 |
| YCQL Op Latency (P99) | The average time (in milliseconds) of the top 99% of DELETE, INSERT, SELECT, and UPDATE transactions, as well as other statements through the YCQL API. | If this value is significantly higher than expected, then it might be a cause for concern and you might want to issue an alert. You should check whether or not there are consistent spikes in latency. |
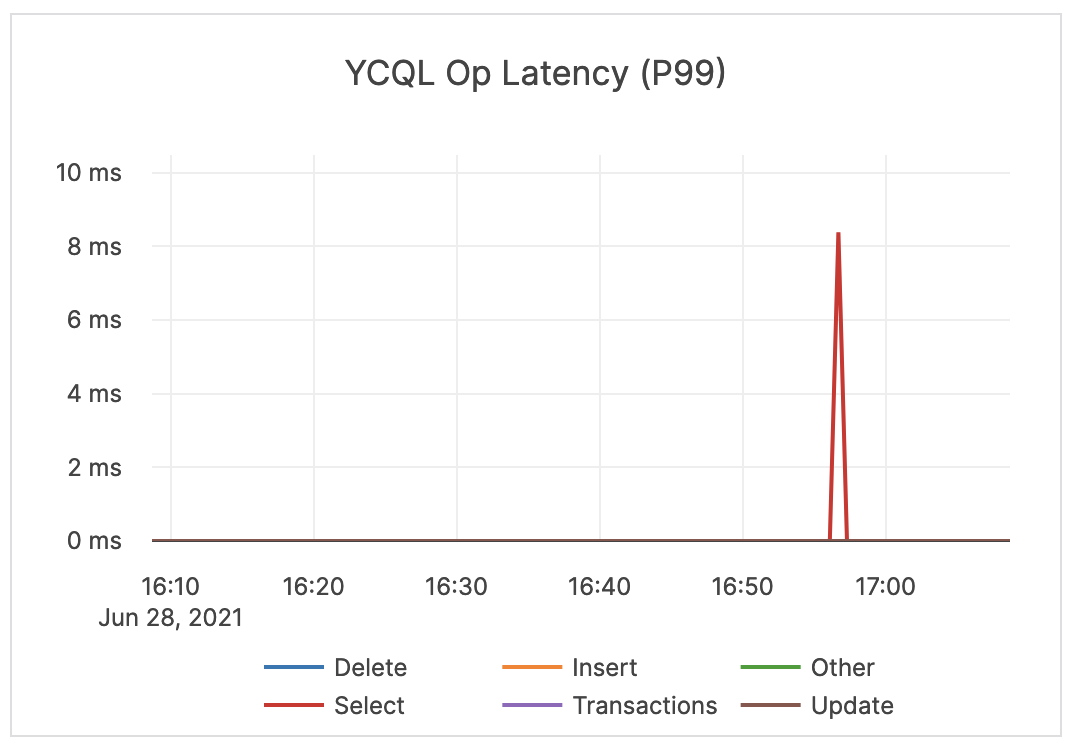 |
Node
Node metrics should be considered on a per-node basis.
| Graph | Description | Alert Guidance | Example |
|---|---|---|---|
| CPU Usage | The percentage of CPU utilization on nodes being consumed by the tablet or master server Yugabyte processes, as well as other processes, if any. In general, CPU usage is a measure of all processes running on the server. The user CPU time is the amount of time the processor worked on all the processes. The system CPU time is the amount of time the processor worked on the operating system’s functions connected to the processes. |
If you have alerts enabled, you should check if you received any high CPU utilization alerts. These alerts could indicate a problem and may require debugging by Yugabyte Support. | 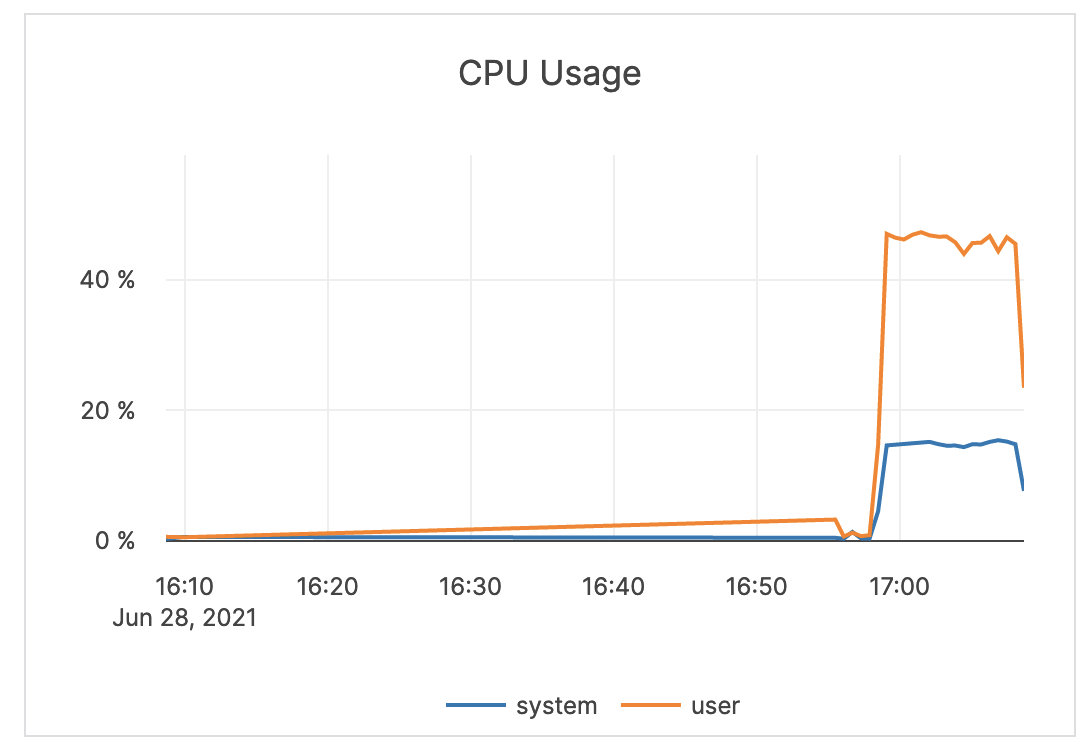 |
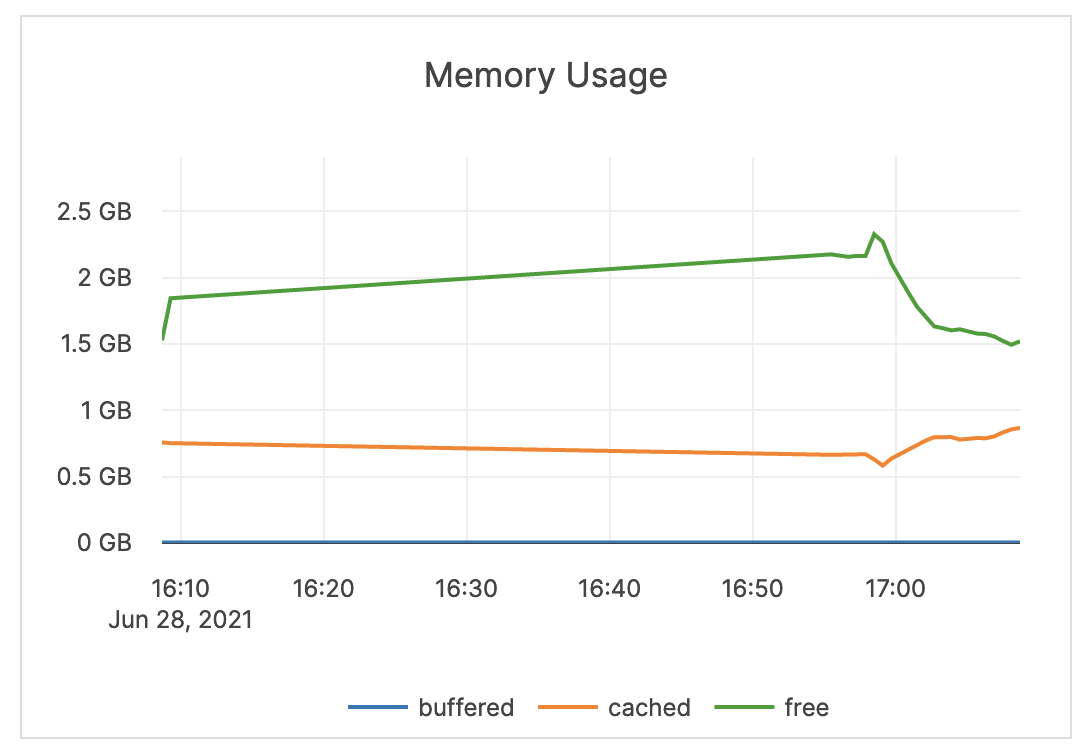
| Memory Usage (Buffered, Cached, Free) | The amount of RAM (in GB) available to the nodes in the cluster. The buffered memory is the size of in-memory block input/output buffers. The cached memory is the size of the page cache. Free memory is not in use. |
An alert should not be issued on memory metrics directly. It is recommended to use another metric to troubleshoot the underlying problem causing any memory bottlenecks. The assumption is that the computer is dedicated to Yugabyte processes, therefore Yugabyte processes aggressively use the memory provided for caches and other operations. |
 |
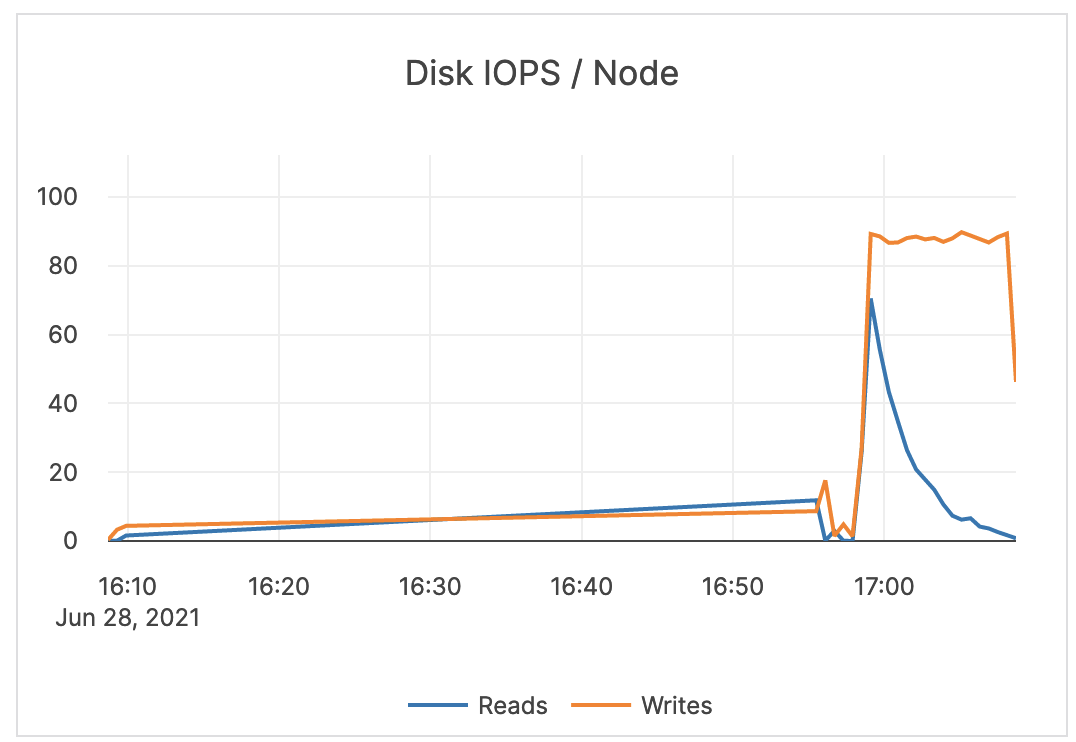
| Disk IOPS / Node | The number of disk input / output read and write operations per second averaged over each node. | Large spikes usually indicate large compactions. Rarely, in cases of a spiky workload, this could indicate block cache misses. Since random reads always hit disk, it is recommended to increase IOPS capacity for this type of workload. You should set an alert to a value much greater than your average or as a percentage of your available IOPS. This value is averaged across all nodes in a cluster. An alert should be issued per node to detect source of underlying issues. |
 |
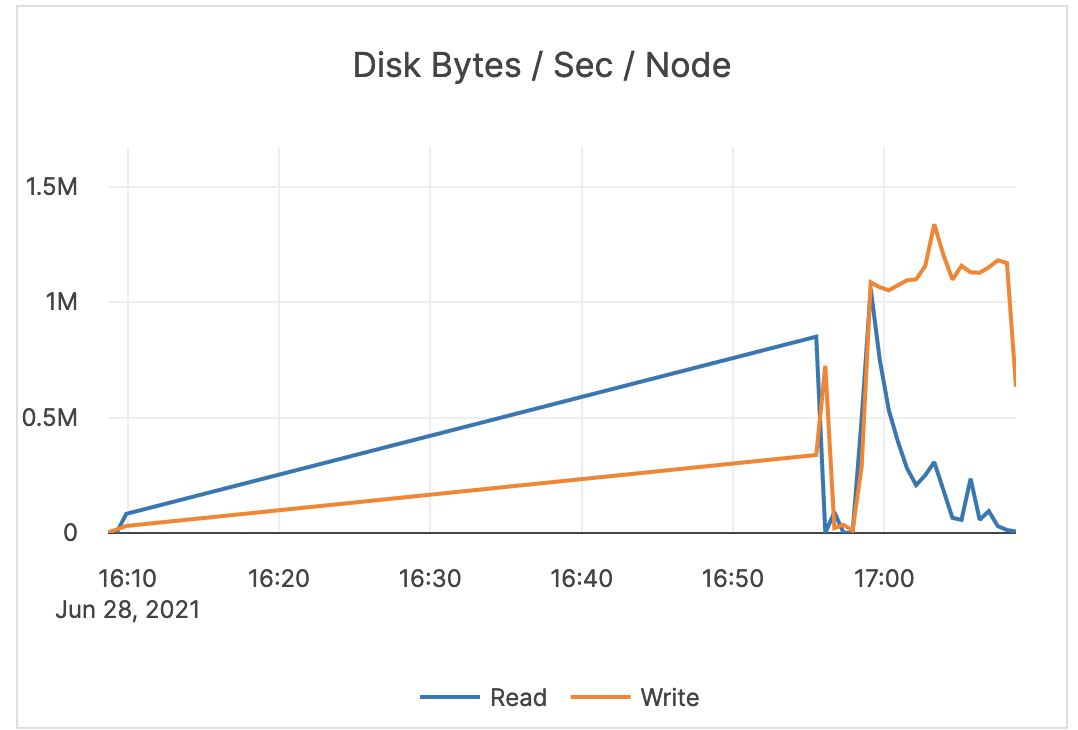
| Disk Bytes / Sec / Node | The number of bytes (scale: millions) being read or written to disk per second, averaged over each node. | If the maximum IOPS for the instance volume type has high utilization, you should ensure that the schema and query are optimized. In addition, consider increasing the instance volume IOPS capacity. |
 |
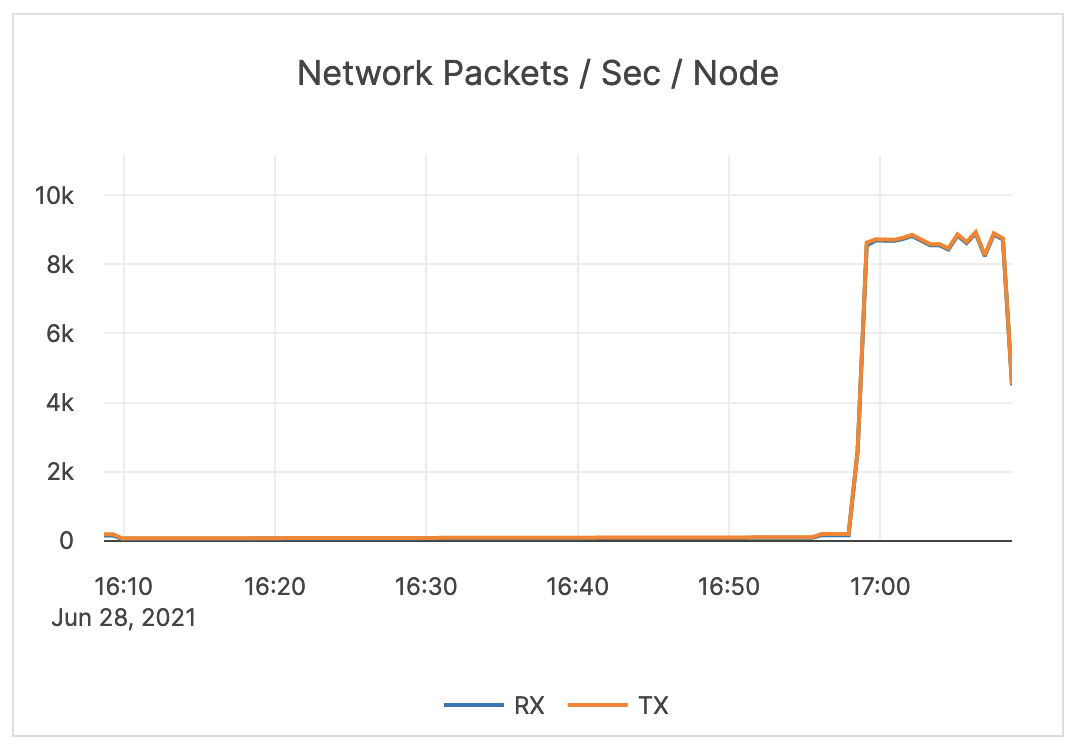
| Network Packets / Sec / Node | The count of network packets received to the server (RX) and transmitted from the server (TX) per second, averaged over nodes. | Provides a view of the intensity of the network activity on the server. This metric is informational and should not be subject to alerting. You may consider this information while examining alerts on other metrics. |
 |
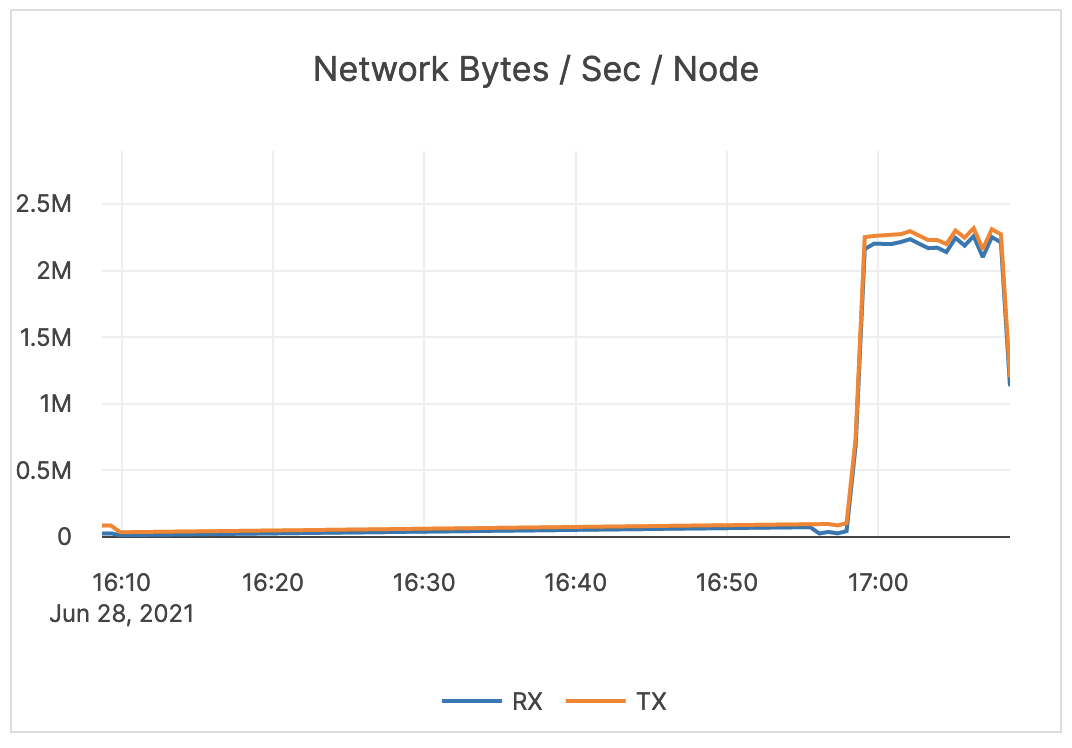
| Network Bytes / Sec / Node | The size (in bytes; scale: millions) of network packets received (RX) and transmitted (TX) per second, averaged over nodes. | Provides a view of the intensity of the network activity on the server. This metric is informational and should not be subject to alerting. You may consider this information while examining alerts on other metrics. |
 |
| Network Errors / Sec / Node | The number of errors related to network packets received (RX) and transmitted (TX) per second, averaged over nodes. | Generally, you should issue an alert for any error. If your environment produces a lot of errors, that could indicate an underlying infrastructure or operating system issue. | 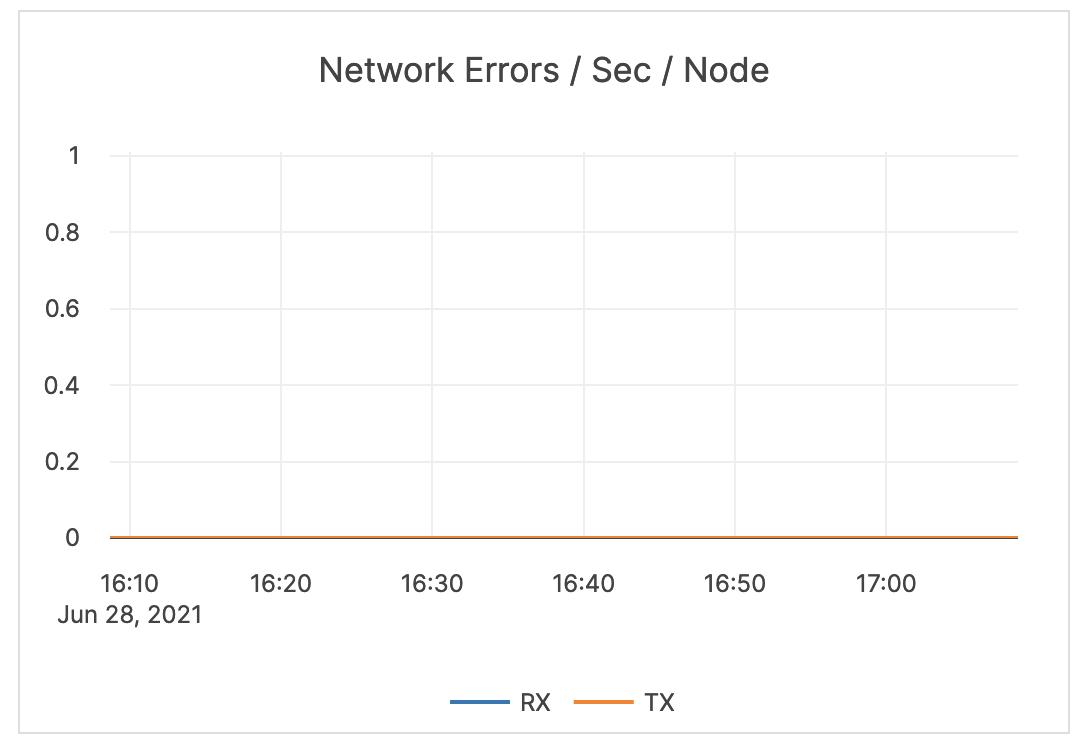 |
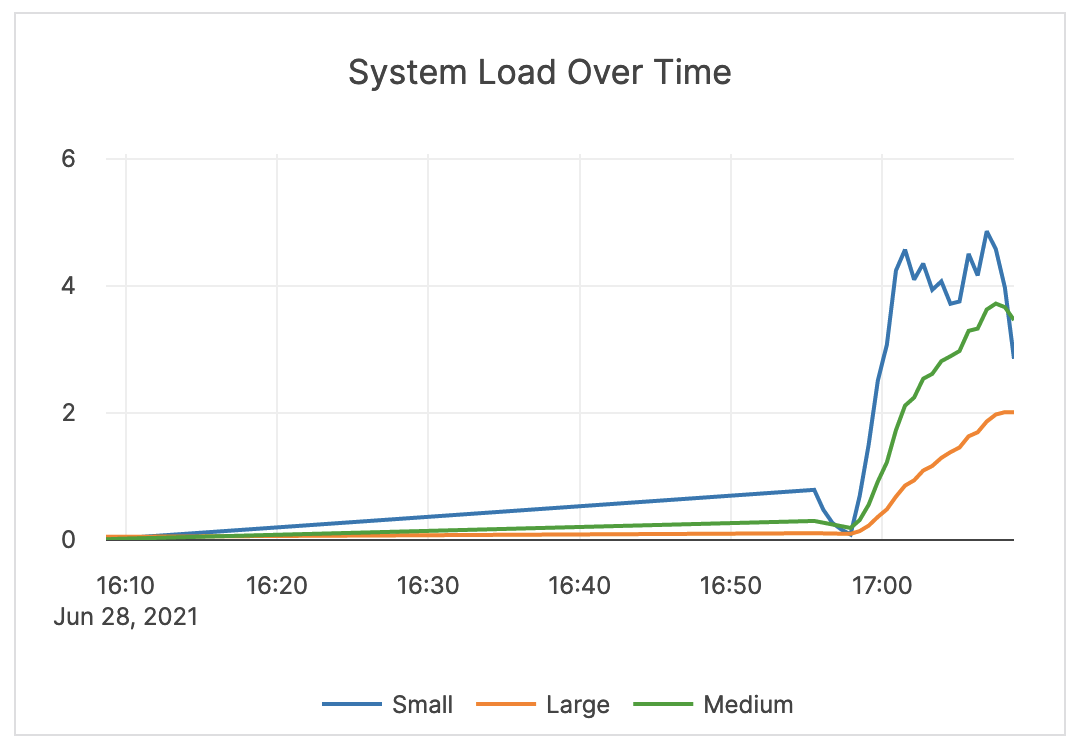
| System Load Over Time | The measure of system load averaged over 1, 5, and 15 minutes. | Values greater than your configured number of cores indicates that processes are waiting for CPU time. It is recommended that you consider your averages when determining the alert threshold. In some cases, this can mean issuing an alert when the 5-minute load average is at 75-80% of available cores on the server. For some systems and workloads, you may want to set the threshold higher (for example, to 4 times the number of cores). |
 |
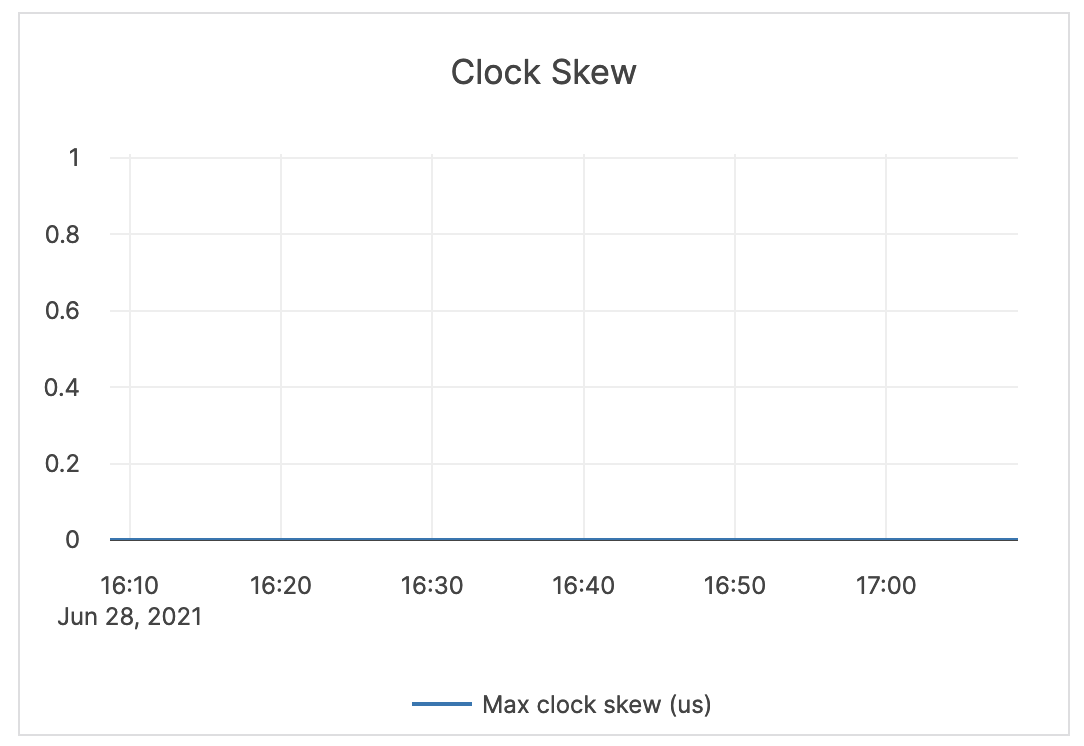
| Clock Skew | For YugabyteDB to preserve data consistency, the clock drift and clock skew across different nodes are configured within bounds. | Clock skew is important for performance and data consistency. An OSS product can refuse to come up or can crash at a default value of 500 milliseconds, as it is considered better to be down than inconsistent. YugabyteDB Anywhere issues alerts at the same threshold, and it should be considered a top priority to resolve this alert. |
 |
YCQL advanced
| Graph | Description | Alert Guidance | Example |
|---|---|---|---|
| YCQL Latency Breakdown | The average time (in milliseconds) spent by the CQL API parsing and executing operations. | This metric is informational and should not be subject to alerting. You may consider this information while examining alerts on other metrics. | 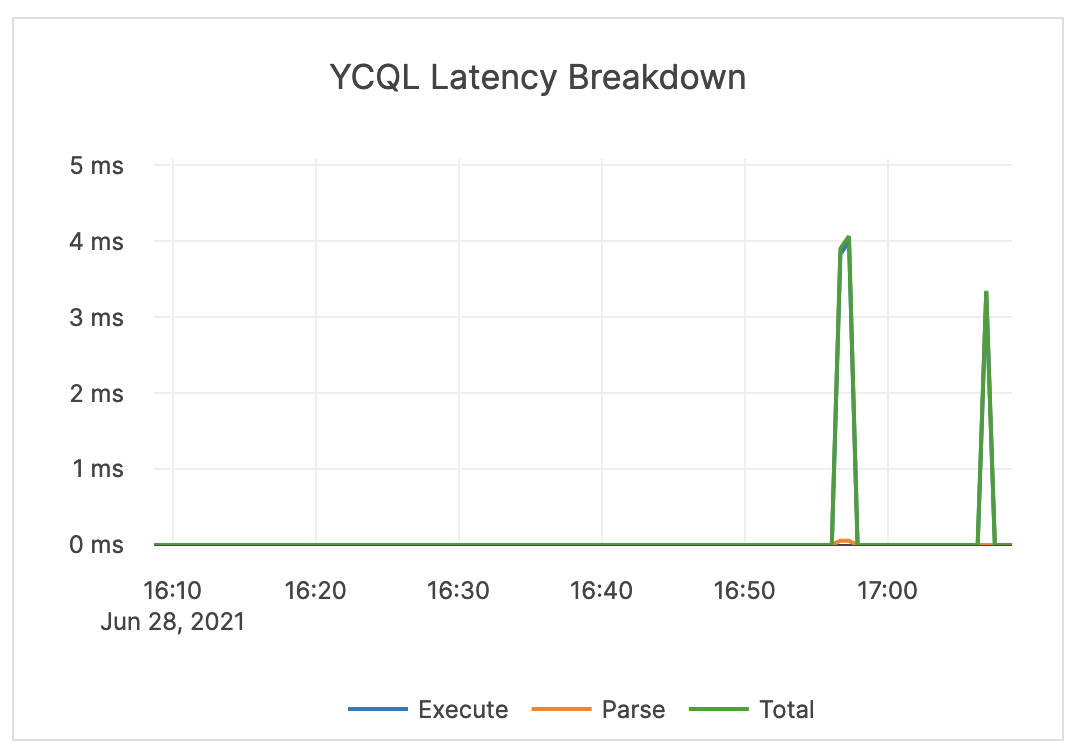 |
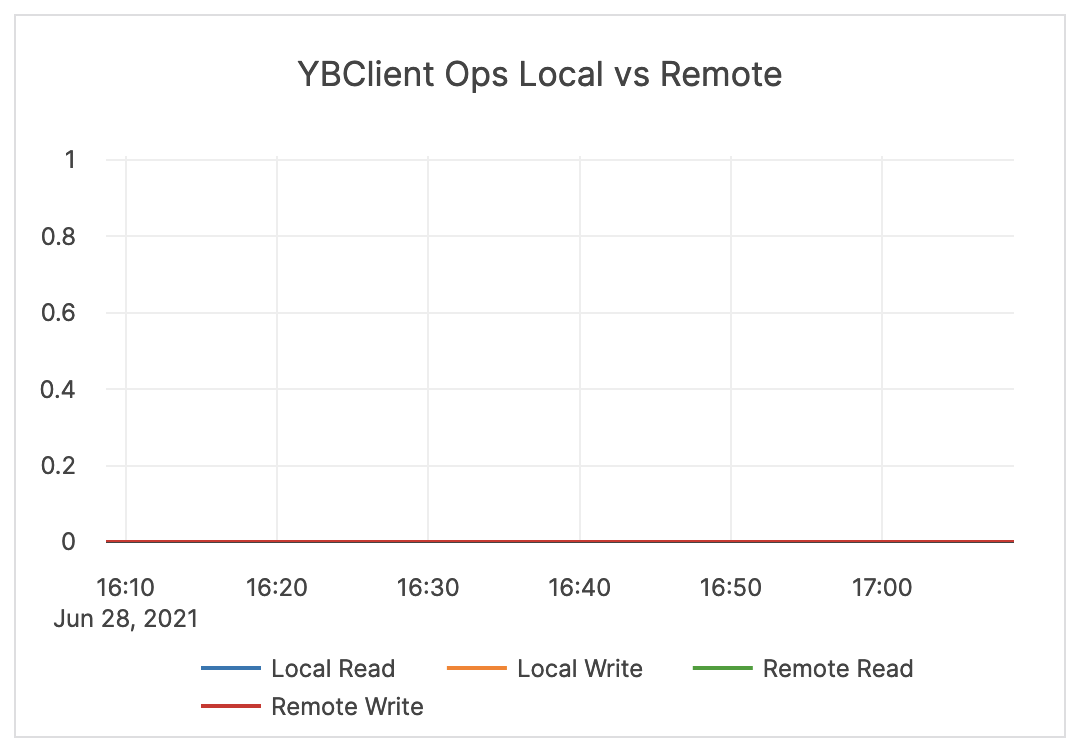
| YBClient Ops Local vs Remote | The count of local and remote read and write requests. Local requests are executed on the same node that has received the request. Remote requests are re-routed internally to a different node for executing the operation. |
If an application is using a Yugabyte driver that supports local query routing optimization and prepared statements, the expected value for this is close to 100% local for local reads and writes. If using the Cassandra driver or not using prepared statements, expect to see a relatively even split (for example, ~33% local and ~66% remote for a 3-node cluster). |
 |
| YBClient Latency | Latency of local and remote read and write requests. Refer to the YBClient Ops Local vs Remote description regarding local and remote requests. |
This metric is informational and should not be subject to alerting. You may consider this information while examining alerts on other metrics. | 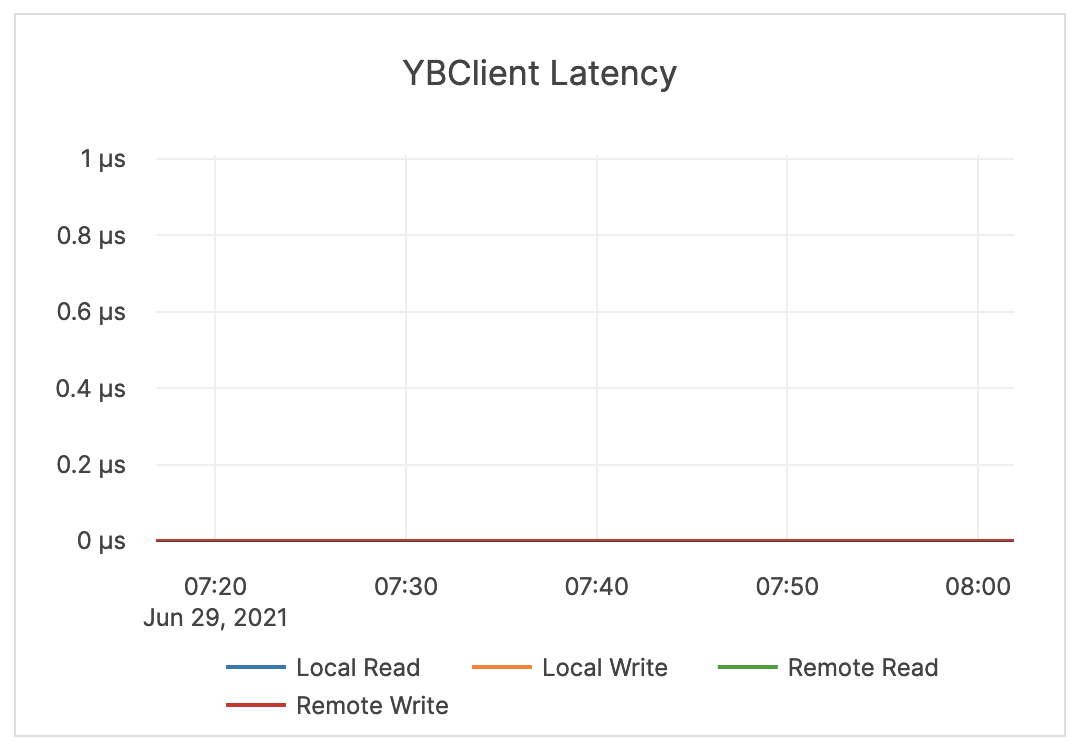 |
| Reactor Delays | Information pending | This value should be close to zero. If it is increasing or stays high, you should treat it as an indicator that the system is being overloaded or that queues are backing up. If this is the case, you should investigate throughput and queue size and latency metrics for tuning guidance. | 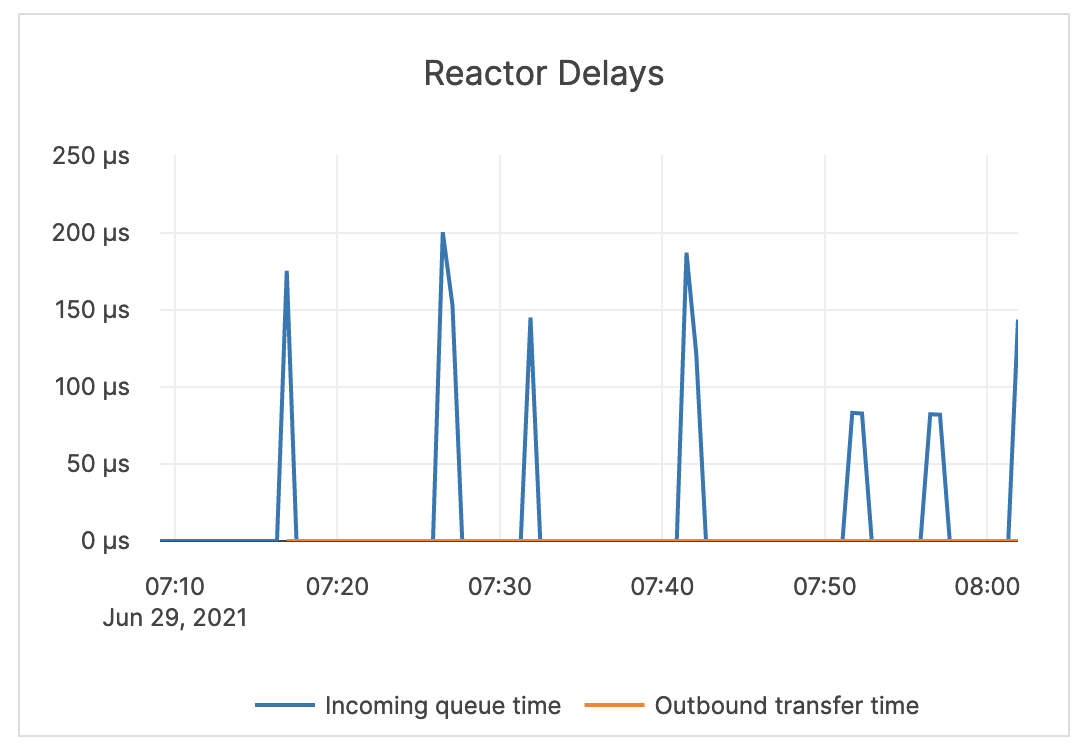 |
| RPC Queue Size | The number of RPCs in the service queue. | The queue size is an indicator of incoming traffic and throughput. Typically, it either shows very low values, which means that YugabyteDB Anywhere is processing requests at a healthy rate, or a flat line at the maximum-configured queue size, which means that YugabyteDB Anywhere has filled the queues and cannot process fast enough. | 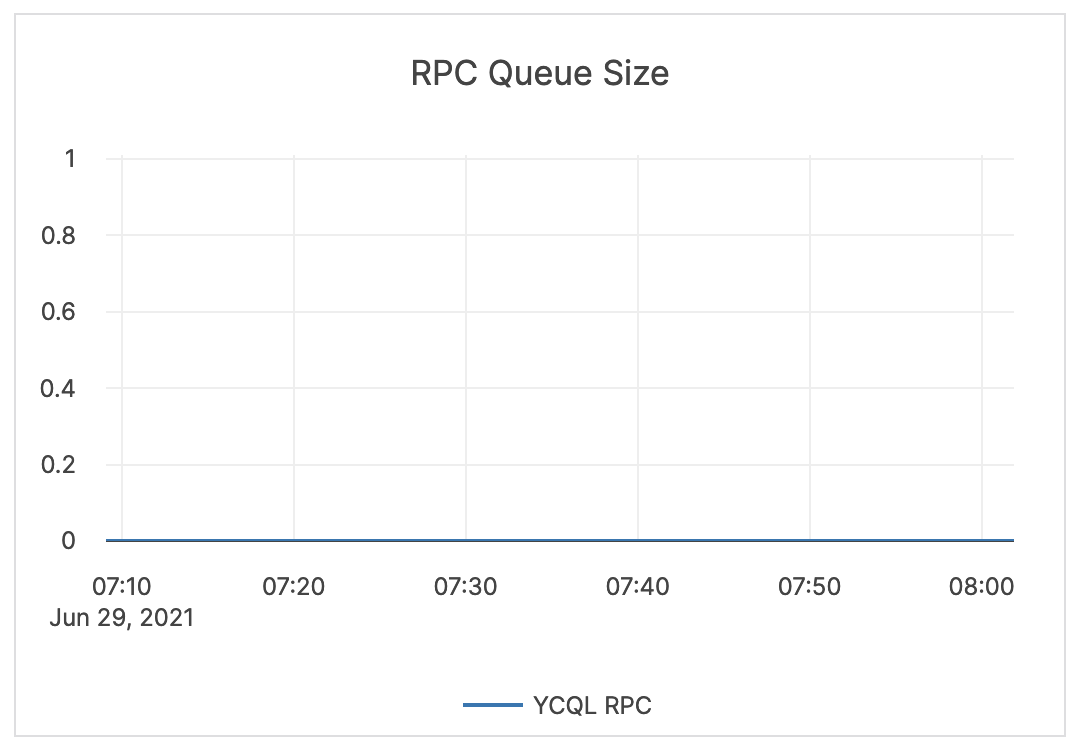 |
| Response Size (bytes) | Information pending | The response size for RPCs should be relatively small. This metric is informational and should not be subject to alerting. You may consider this information while examining alerts on other metrics. |
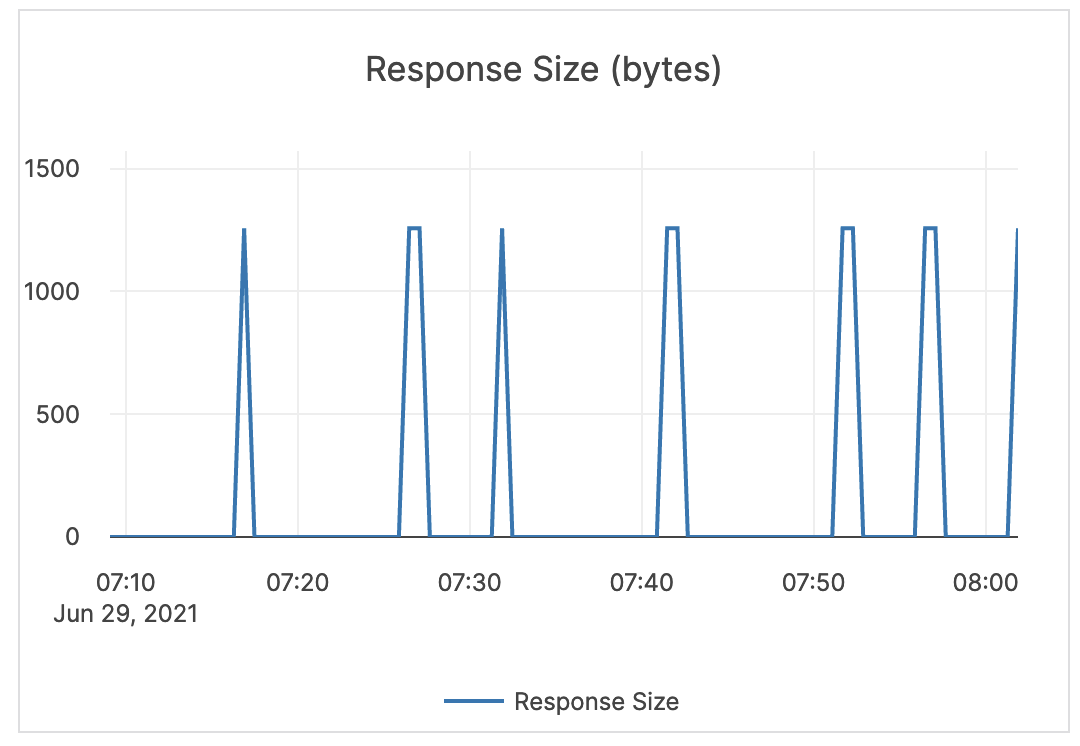 |
| Transaction | The number of transactions. | This value depends on the application or activity. Since transactions can have batched statements, it is not possible to provide a specific guidance for this metric, as it is purely informational and should not be subject to alerting. You may consider this information while examining alerts on other metrics. | 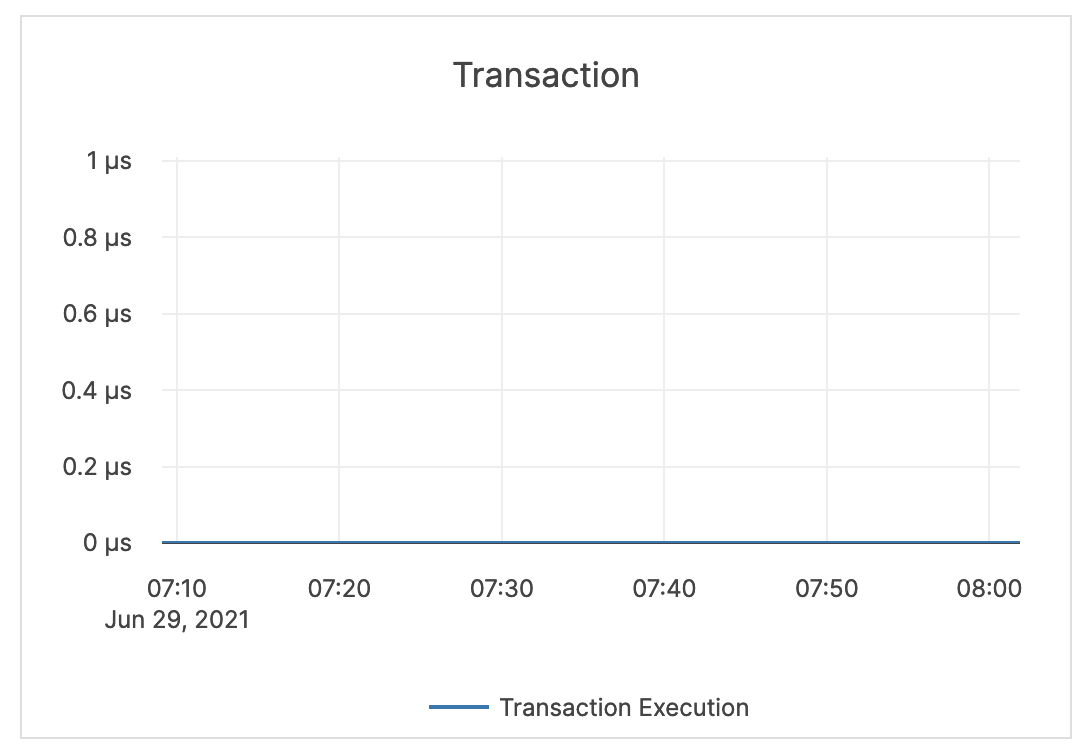 |
| Inbound RPC Connections Alive | The count of current connections at the CQL API level. | If this spikes to a number much higher than your average, you should consider that there may be an active DDoS or a security incident. | 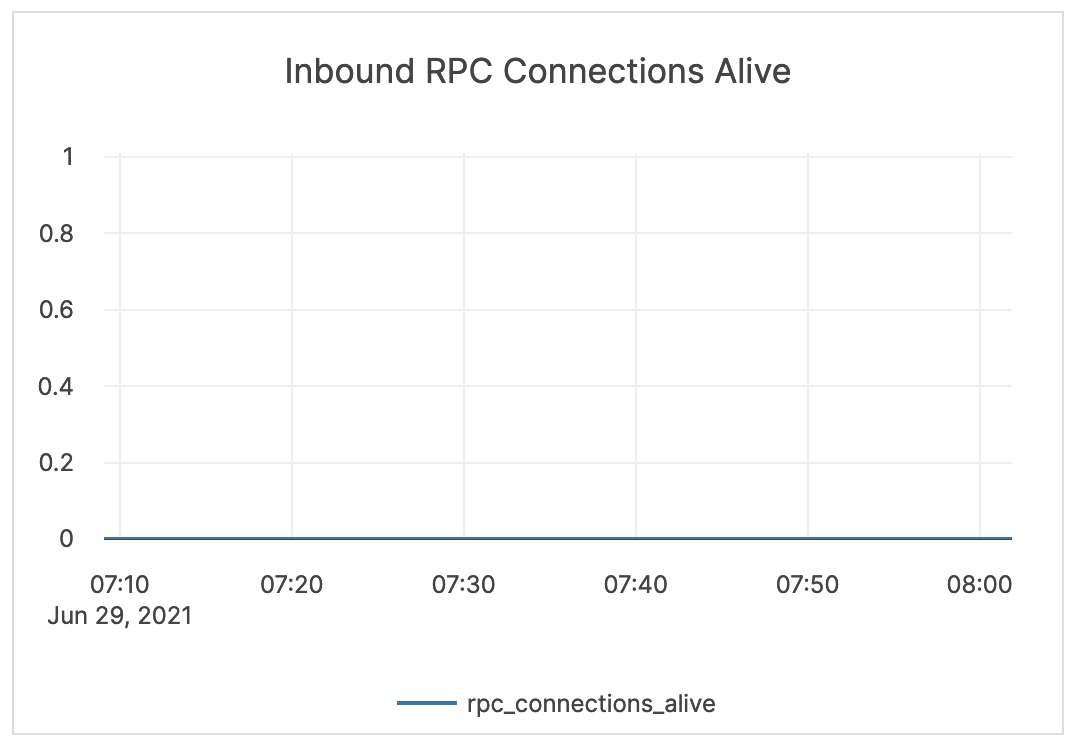 |
Tablet server
| Graph | Description | Alert Guidance | Example |
|---|---|---|---|
| Ops / Sec / Node | This is the key throughput measure. Read: the count of read operations at the tablet level. Write: the count of write operations at the tablet level. |
This metric is informational and should not be subject to alerting. You may consider this information while examining alerts on other metrics. | 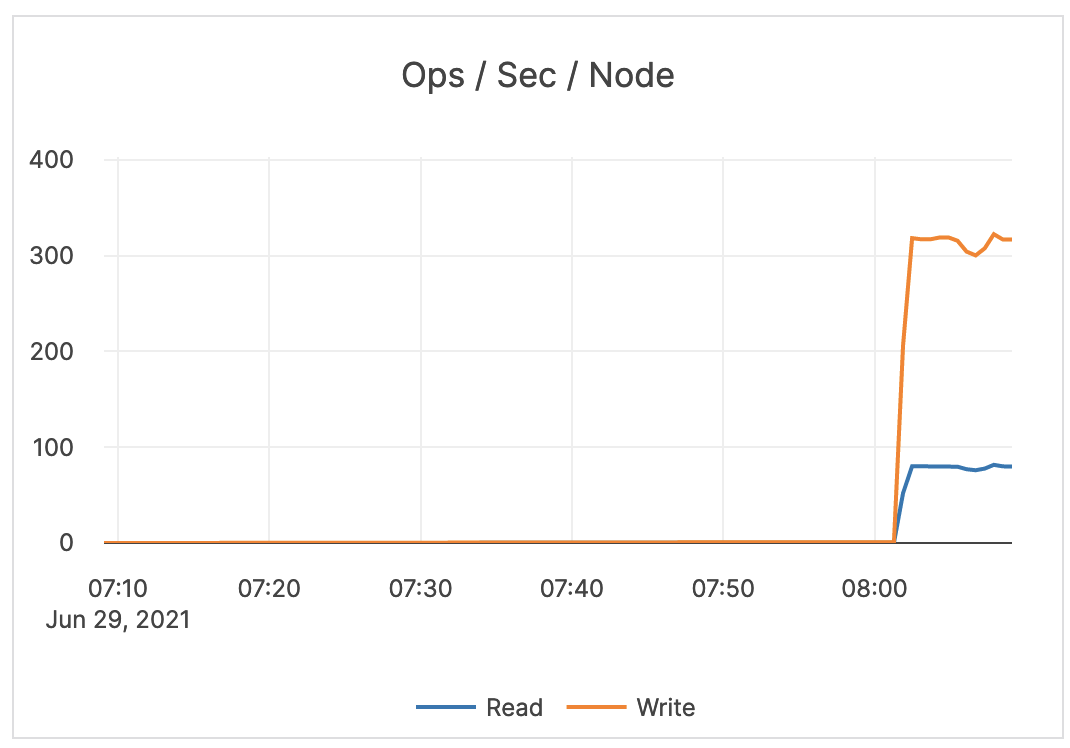 |
| Average Latency | Read: the average latency of read operations at the tablet level. Write: the average latency of write operations at the tablet level. |
This metric is informational and should not be subject to alerting. You may consider this information while examining alerts on other metrics. | 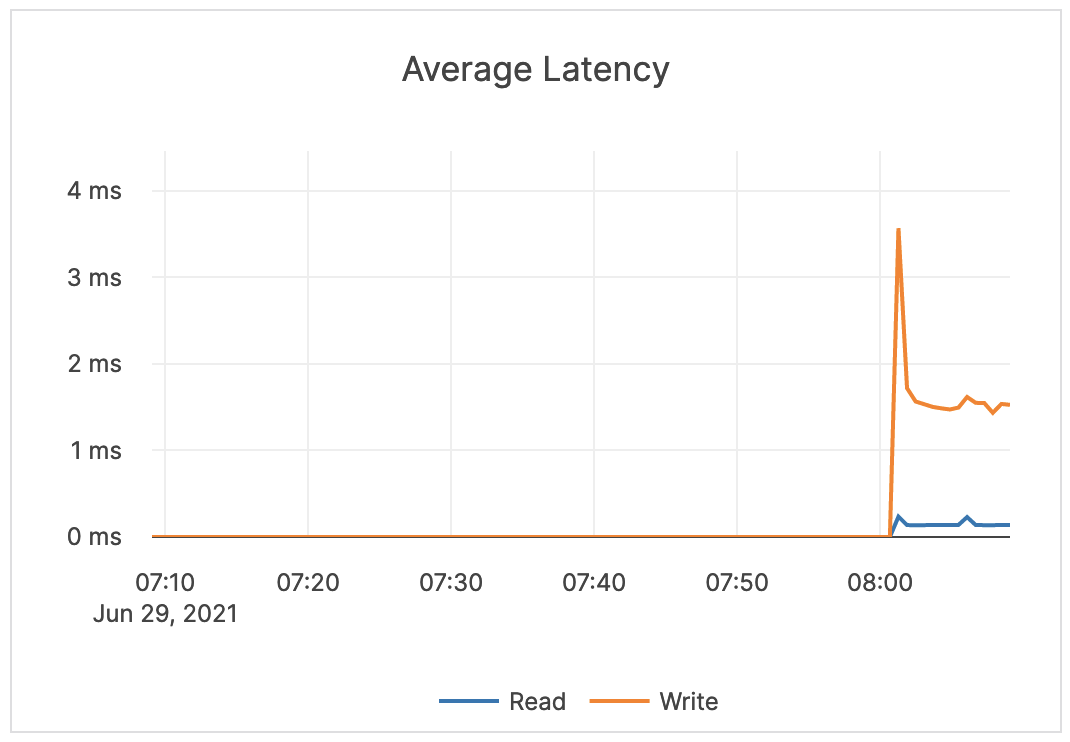 |
| Reactor Delays | The number of microseconds the incoming RPC requests spend in the worker queue before the beginning of processing. Note that Reactor is a software implementation of a ring queue. |
If this metric spikes or remains at a high level, it indicates a network issue or that the queues are full. | 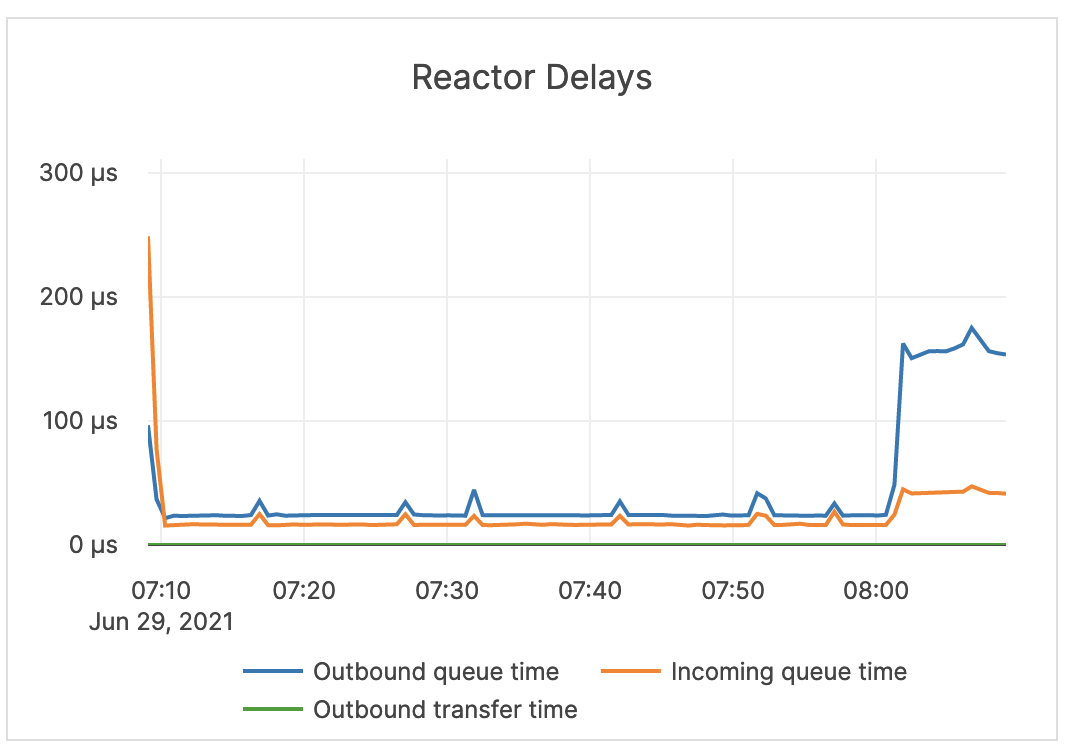 |
| Threads | Running: the current number of running threads. Started: the total number of threads started on this server. |
This metric is informational and should not be subject to alerting. You may consider this information while examining alerts on other metrics. | 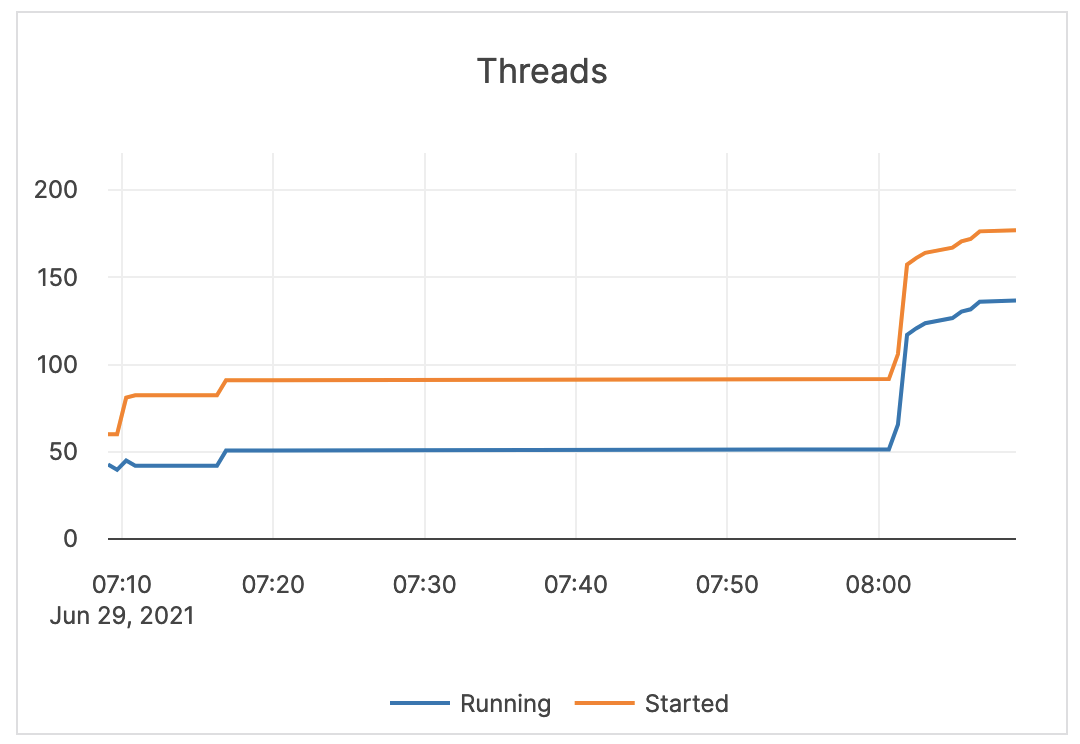 |
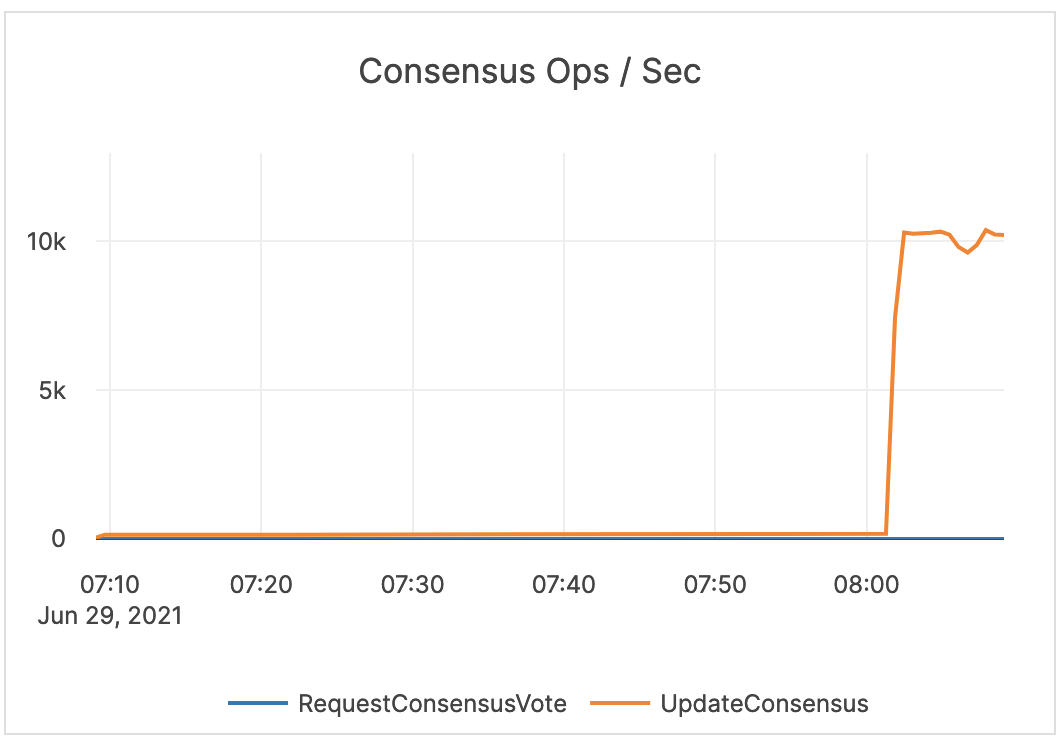
| Consensus Ops / Sec | Yugabyte implements the RAFT consensus protocol, with minor modifications. Update: replicas implement an RPC method called UpdateConsensus which allows a leader to replicate a batch of log entries to the follower. Only a leader may call this RPC method, and a follower can only accept an UpdateConsensus call with a term equal to or higher than its currentTerm. Request: replicas also implement an RPC method called RequestConsensusVote, which is invoked by candidates to gather votes. |
A high number for the Request Consensus indicates that a lot of replicas are looking for a new election because they have not received a heartbeat from the leader. A high CPU or a network partition can cause this condition, and therefore it should result in issuing an alert. |
 |
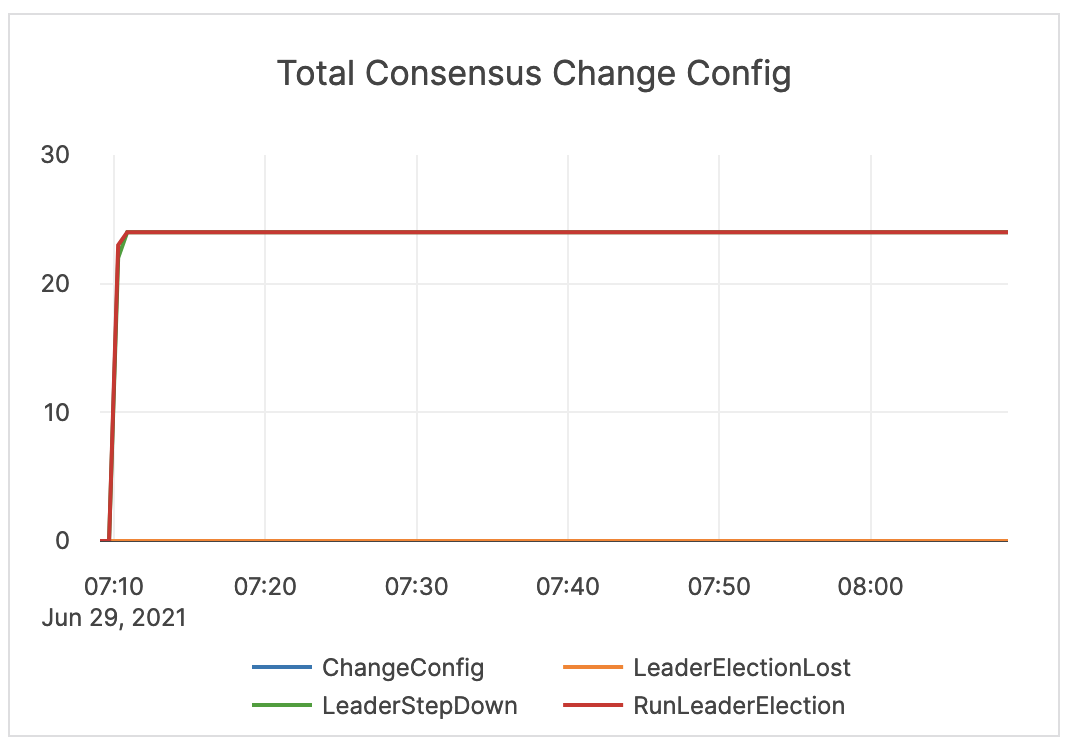
| Total Consensus Change Config | This metric is related to the RAFT Consensus Process. ChangeConfig: the number of times a peer was added or removed from the consensus group. LeaderStepDown: the number of leader changes. LeaderElectionLost: the number of times a leader election has failed. RunLeaderElection: the count of leader elections due to a node failure or network partition. |
You should issue an alert on LeaderElectionLost. An increase in ChangeConfig typically happens when YugabyteDB Anywhere needs to move data around. This may happen as a result of a planned server addition or decommission, or a server crash looping. A LeaderStepDown can indicate a normal change in leader, or it could be an indicator of a high CPU, blocked RPC queues, server retstarts, and so on. You should issue an alert on LeaderStepDown as a proxy for other system issues. |
 |
| Remote Bootstraps | The total count of remote bootstraps. | When a RAFT peer fails, YugabyteDB executes an automatic remote bootstrap to create a new peer from the remaining ones. Bootstrapping can also be a result of planned user activity when adding or decommissioning nodes. It is recommended to issue an alert on a change in this count outside of planned activity. |
 |
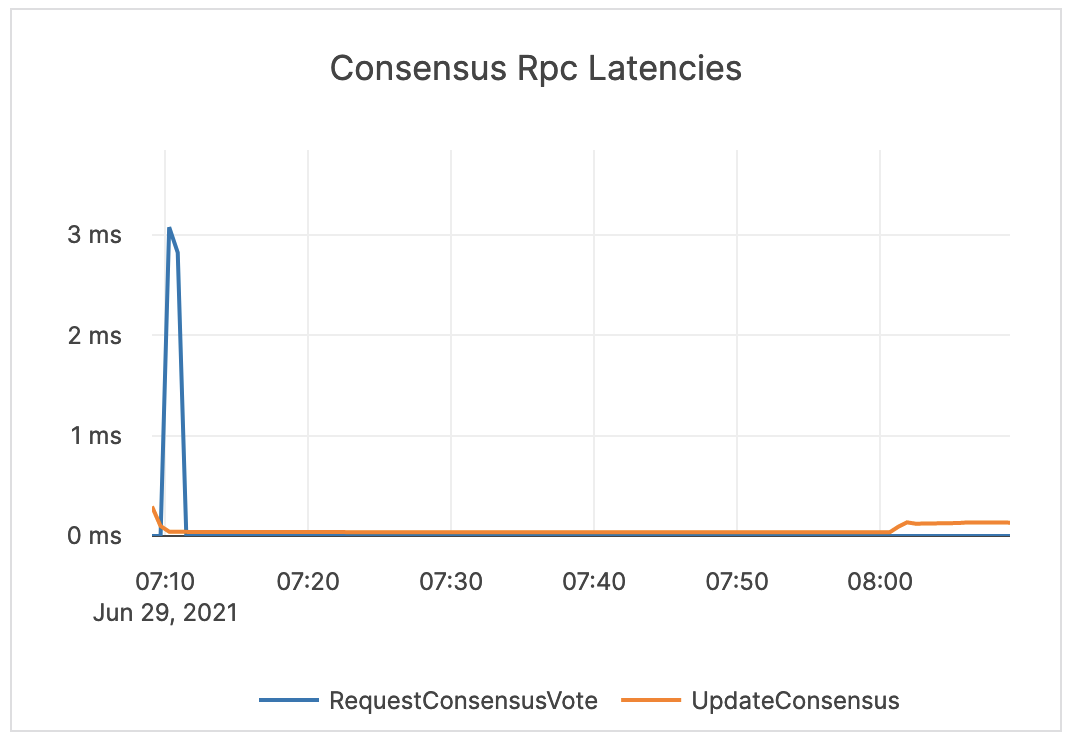
| Consensus RPC Latencies | RequestConsensus: latency (in milliseconds) of consensus request operations. UpdateConsensus: latency (in milliseconds) of consensus update operations. |
If the value is high, it is likely that the overall latency is high. This metric should be treated as a starting point in debugging the Master and T-server processes. |
 |
| Change Config Latency | Latency (in microseconds or milliseconds) of consensus change configuration processes. | This metric is informational and should not be subject to alerting. You may consider this information while examining alerts on other metrics. |  |
| Context Switches | Voluntary context switches are writer processes that take a lock. Involuntary context switches happen when a writer process has waited longer than a set threshold, which results in other waiting processes taking over. |
A large number of involuntary context switches indicates a CPU-bound workload. | 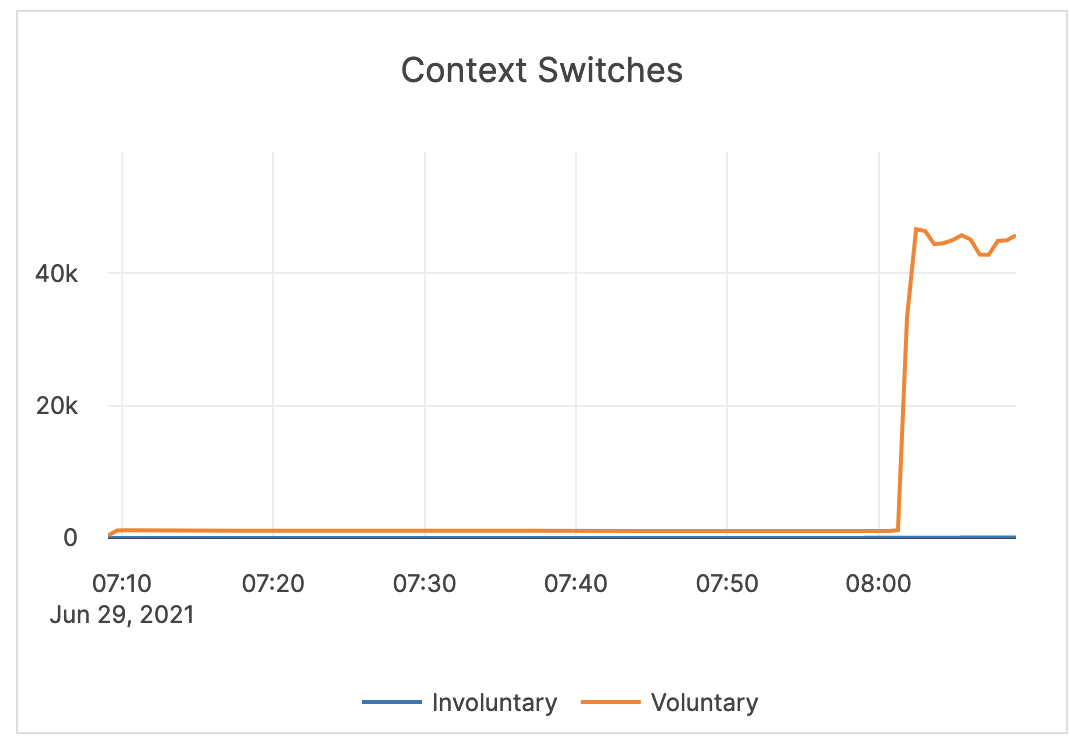 |
| Spinlock Time / Server | Spinlock is a measurement of processes waiting for a server resource and using a CPU to check and wait repeatedly until the resource is available. | This value can become very high on large computers with many cores. The GFlag tserver_tcmalloc_max_total_thread_cache_bytes is by default 256 MB, and this is typically sufficient for 16-core computers with less than 32 GB of memory. For larger computers, it is recommended to increase this to 1 GB or 2 GB.You should monitor memory usage, as this requires more memory. |
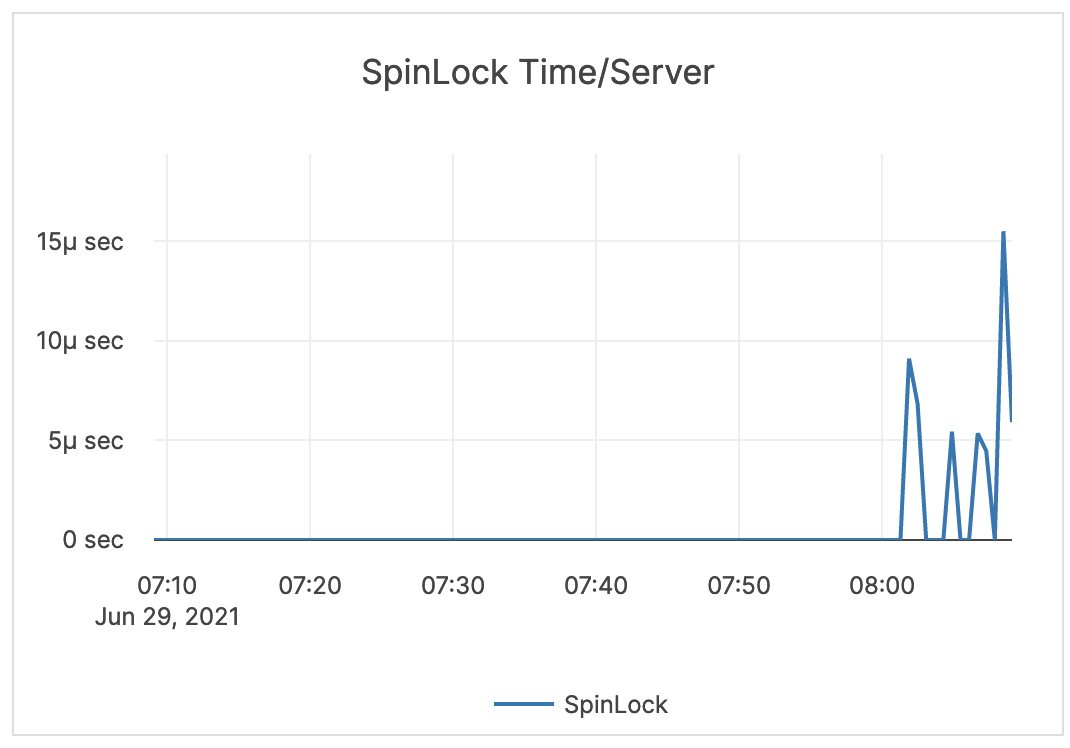 |
| TServer Log Latency / WAL Latency | This is related to WALs. Commit (Log Group Commit Latency): the number of microseconds spent on committing an entire group. Append (Log Append Latency): the number of microseconds spent on appending to the log segment file. Sync (Log Sync Latency): the number of microseconds spent on synchronizing the log segment file. |
These metrics provide information on the amount to time spent writing to a disk. You should perform tuning accordingly. | 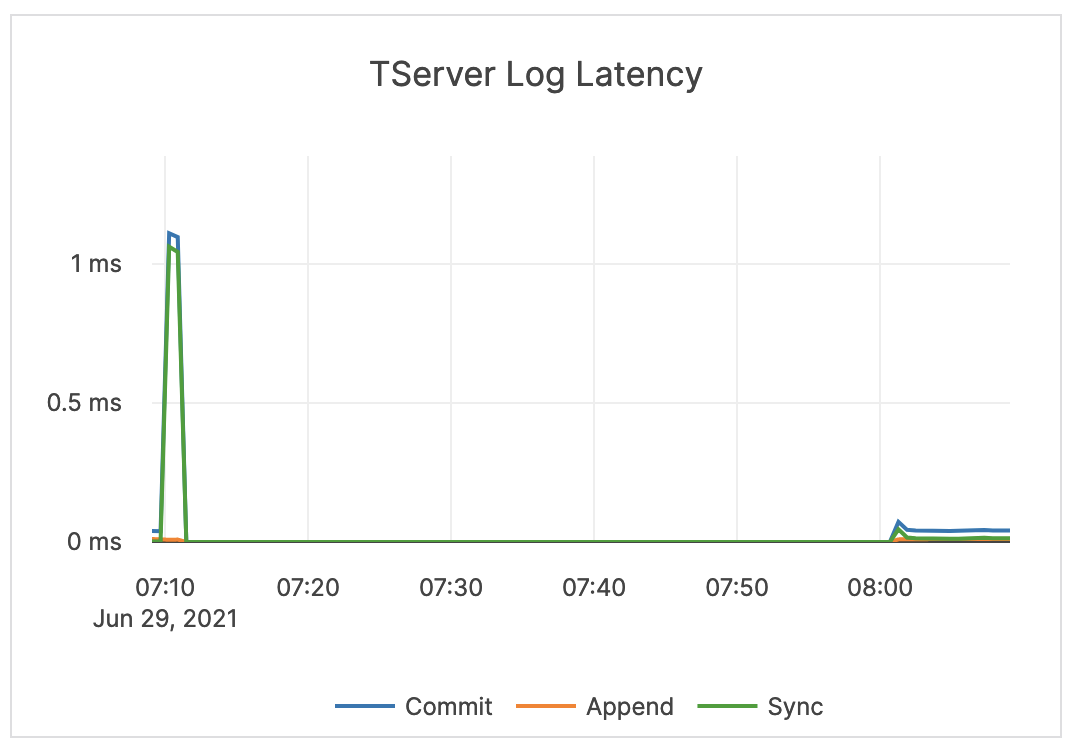 |
| Log / WAL Bytes Written / Sec / Node | The number of bytes written to the WAL since the tablet start. | This metric is informational and should not be subject to alerting. You may consider this information while examining alerts on other metrics. | 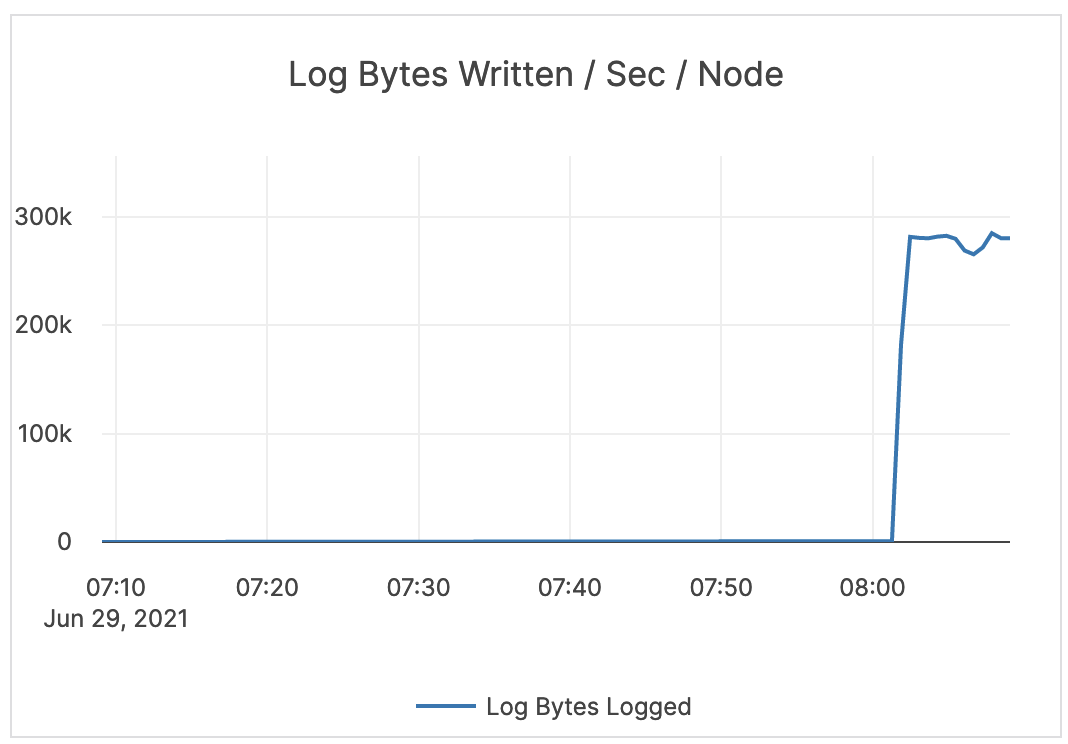 |
| Log / WAL Bytes Read / Sec / Node | The number of bytes read from the WAL since the tablet start. | It is recommened to issue an alert on values higher than the normal range. An increase indicates that followers are falling behind and are constantly trying to catch up. In an xCluster replication topology, this can indicate replication latency. |
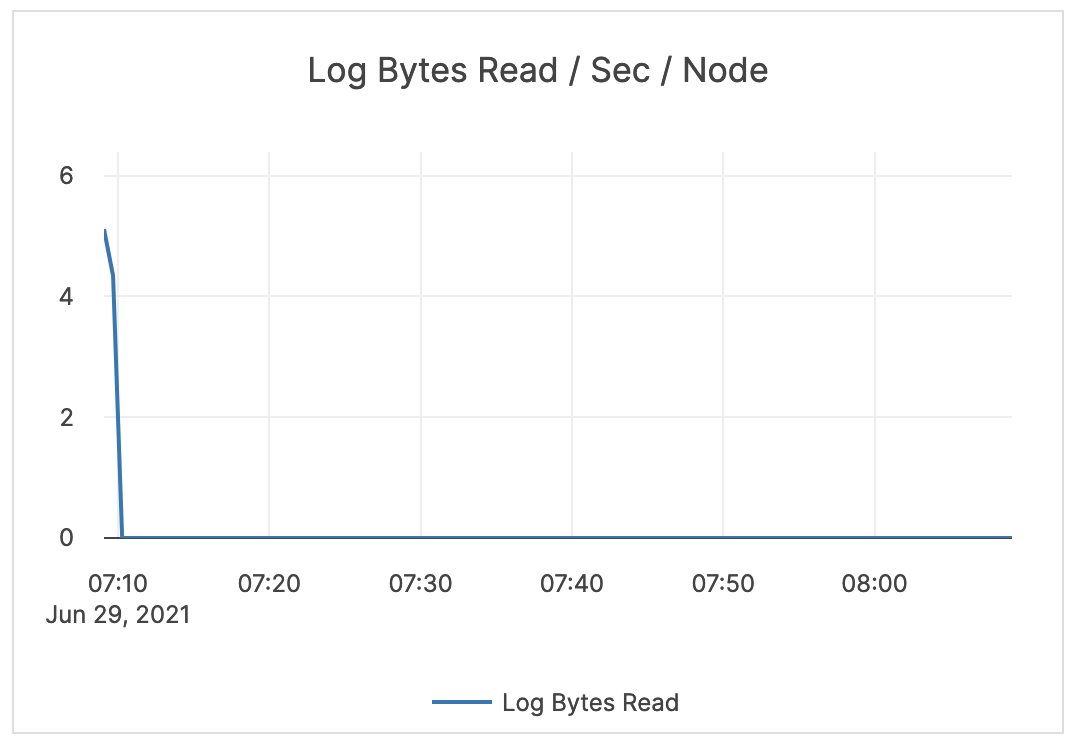 |
| TServer Log / WAL Ops / Sec / Node | This is related to WALs. Commit (Log Group Commit Count): the number of commits of an entire group, per second, per node. Append (Log Append Count): the number of appends to the log segment file, per second, per node. Sync (Log Sync Count): the number of syncs for the log segment file, per second, per node. |
This metric is informational and should not be subject to alerting. You may consider this information while examining alerts on other metrics. | 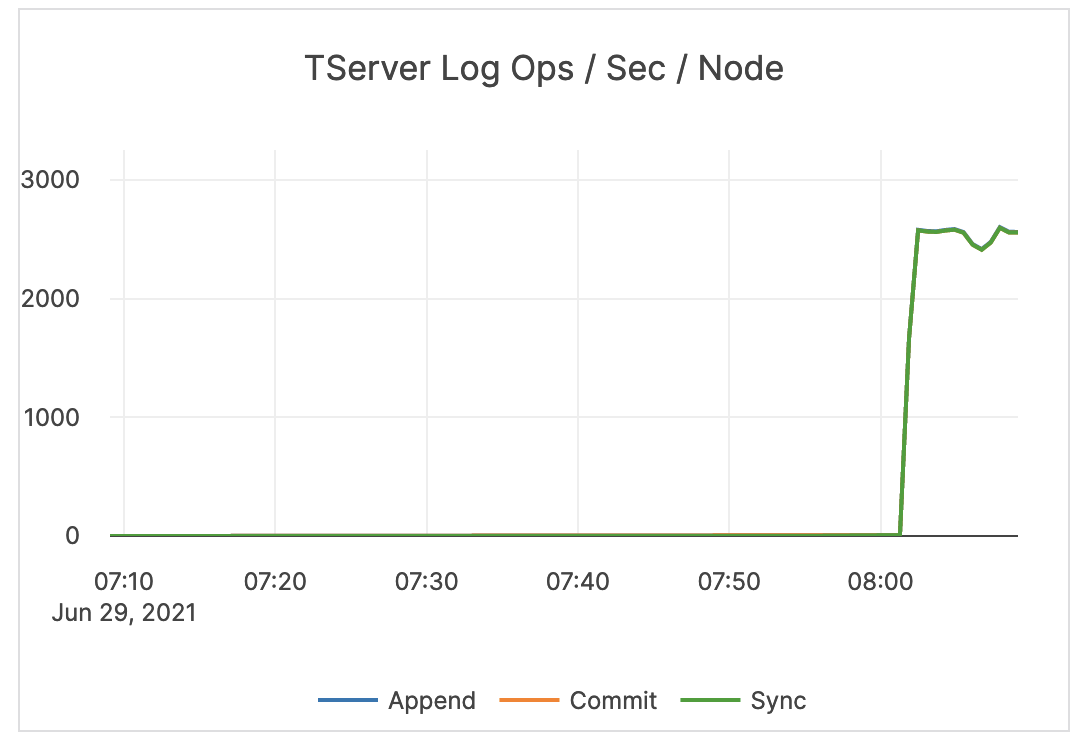 |
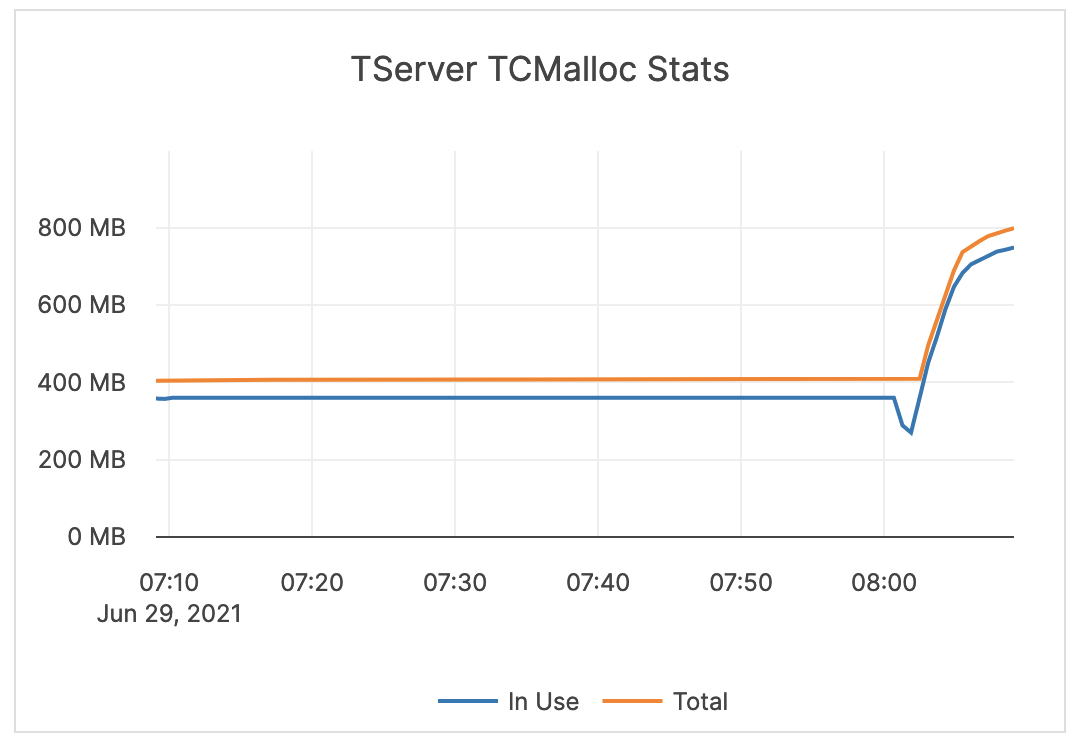
| TServer TCMalloc Stats | In Use (Heap Memory Usage): the number of bytes used by the application. Typically, this does not match the memory use reported by the OS because it does not include TCMalloc overhead or memory fragmentation. Total (Reserved Heap Memory): the number of bytes of the system memory reserved by TCMalloc. |
This metric is informational and should not be subject to alerting. You may consider this information while examining alerts on other metrics. Also consider the following: Free Heap Memory: the number of bytes in free, mapped pages in a page heap. These bytes can be used to fulfill allocation requests. They always count towards virtual memory usage, and unless the underlying memory is swapped out by the OS, they also count towards physical memory usage. Unmapped Heap Memory: the number of bytes in free, unmapped pages in a page heap. These are bytes that have been released back to the OS, possibly by one of the MallocExtension Release calls. They can be used to fulfill allocation requests, but typically incur a page fault. They always count towards virtual memory usage, and depending on the OS, usually do not count towards physical memory usage. Thread Cache Memory Limit: a limit to the amount of memory that TCMalloc dedicates for small objects. In some cases, larger numbers trade off more memory use for improved efficiency. Thread Cache Memory Usage: a measure of some of the memory TCMalloc is using (for small objects). |
 |
| Log / WAL Stats / Node | Log bytes read: the size (in bytes) of reads from the WAL since the tablet start. Log cache size: the total per-tablet size of consensus entries kept in memory. The log cache attempts to keep all entries which have not yet been replicated to all followers in memory, but if the total size of those entries exceeds the configured limit within an individual tablet, the oldest is evicted. |
If the log cache size is greater than zero, the followers are behind. You should issue an alert if the value spikes or remains above zero for an extended period of time. | 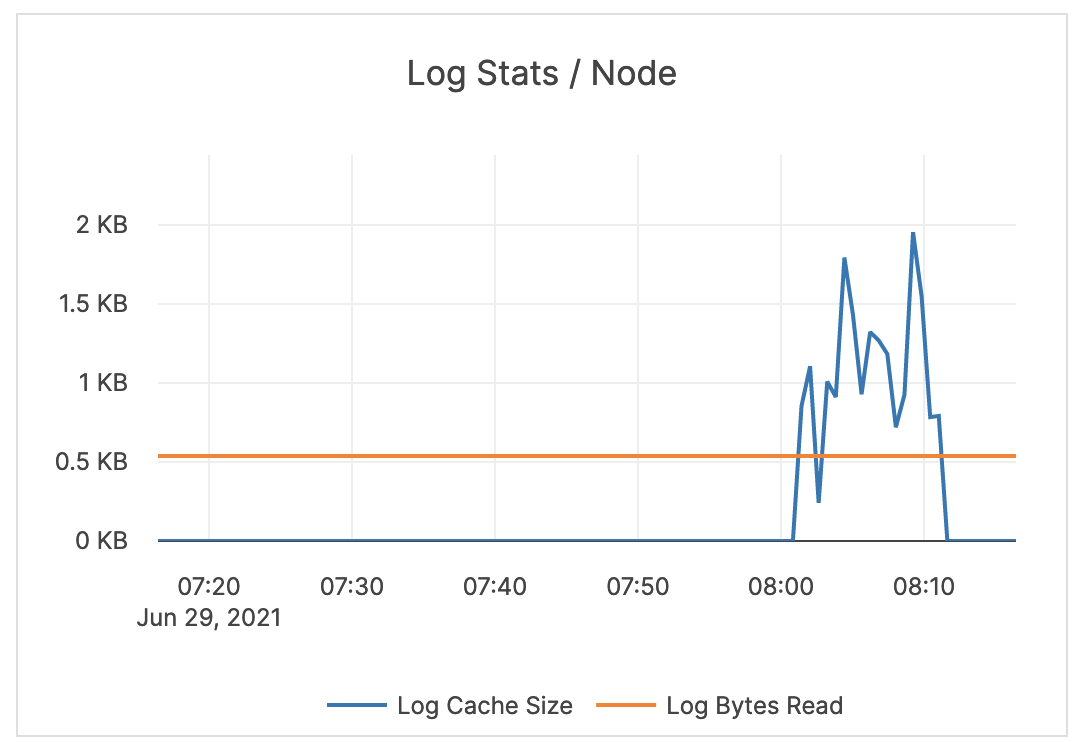 |
| Log / WAL Cache Num Ops / Node | The number of times the log cache is accessed. | Outside of an xCluster replication deployment, a number greater than zero means some of the followers are behind. | 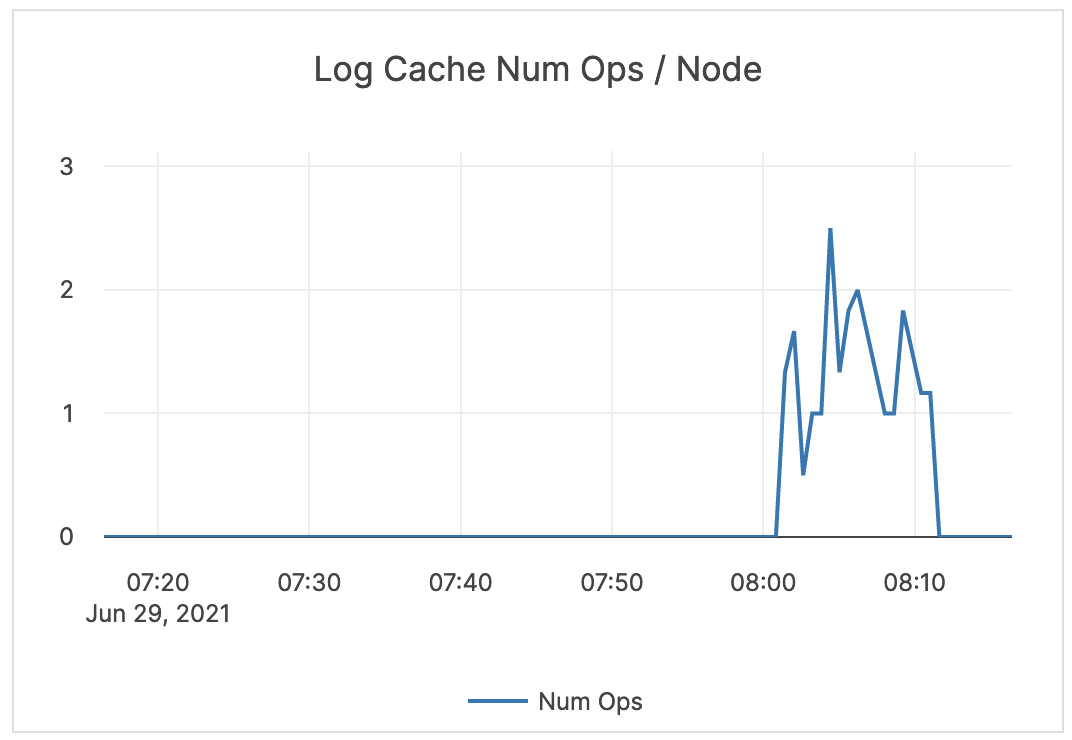 |
| GLog messages | The following log levels are available: Info: the number of INFO-level log messages emitted by the application. Warning: the number of WARNING-level log messages emitted by the application. Error: the number of ERROR-level log messages emitted by the application. |
It is recommended to use a log aggregation tool for log analysis. You should review the ERROR-level log entries on a regular basis. | 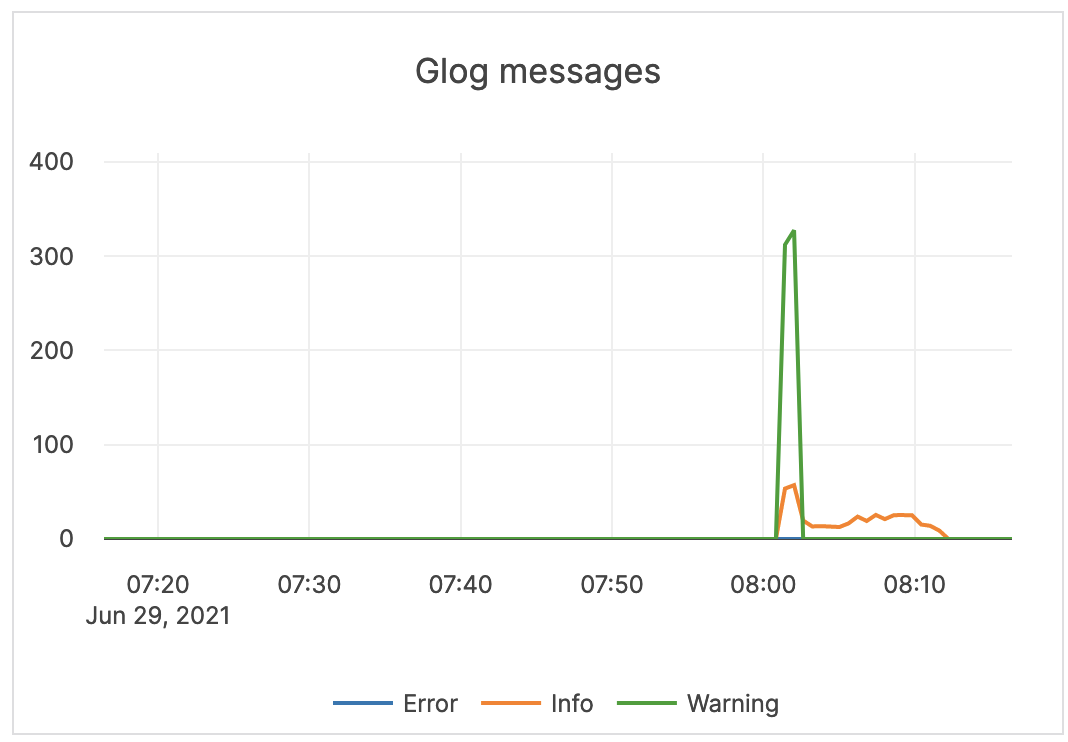 |
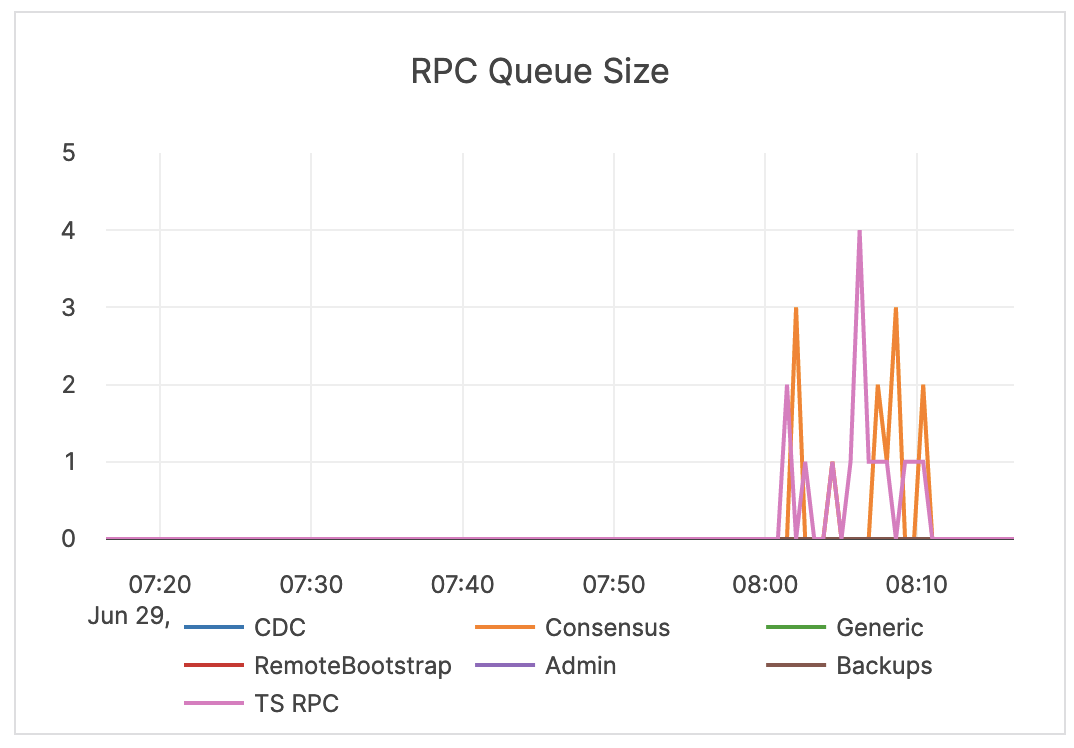
| RPC Queue Size | The number of RPCs in service queues for tablet servers: CDC (Change Data Capture) Service Remote Bootstrap Service TS RPC (Tablet Server Service) Consensus Service Admin Service Generic Service Backup Service |
The queue size is an indicator of the incoming traffic. If the backends get overloaded, requests pile up in the queues. When the queue is full, the system responds with backpressure errors. Also consider the following Prometheus metrics: rpcs_timed_out_in_queue - the number of RPCs whose timeout elapsed while waiting in the service queue, which resulted in these RPCs not having been processed. This number does not include calls that were expired before an attempt to execute them has been made.rpcs_timed_out_early_in_queue - the number of RPCs whose timeout elapsed while waiting in the service queue, which resulted in these RPCs not having been processed. The timeouts for these calls were detected before the calls attempted to execute.rpcs_queue_overflow - the number of RPCs dropped because the service queue was full. |
 |
| CPU Util Secs / Sec (Tablet Server) | The tablet server CPU utilization. | The tablet server should not use the full allocation of CPUs. For example, on a 4-core computer, three cores are used by the tablet server, but if the usage is usually close to three, you should increase the number of available CPUs. | 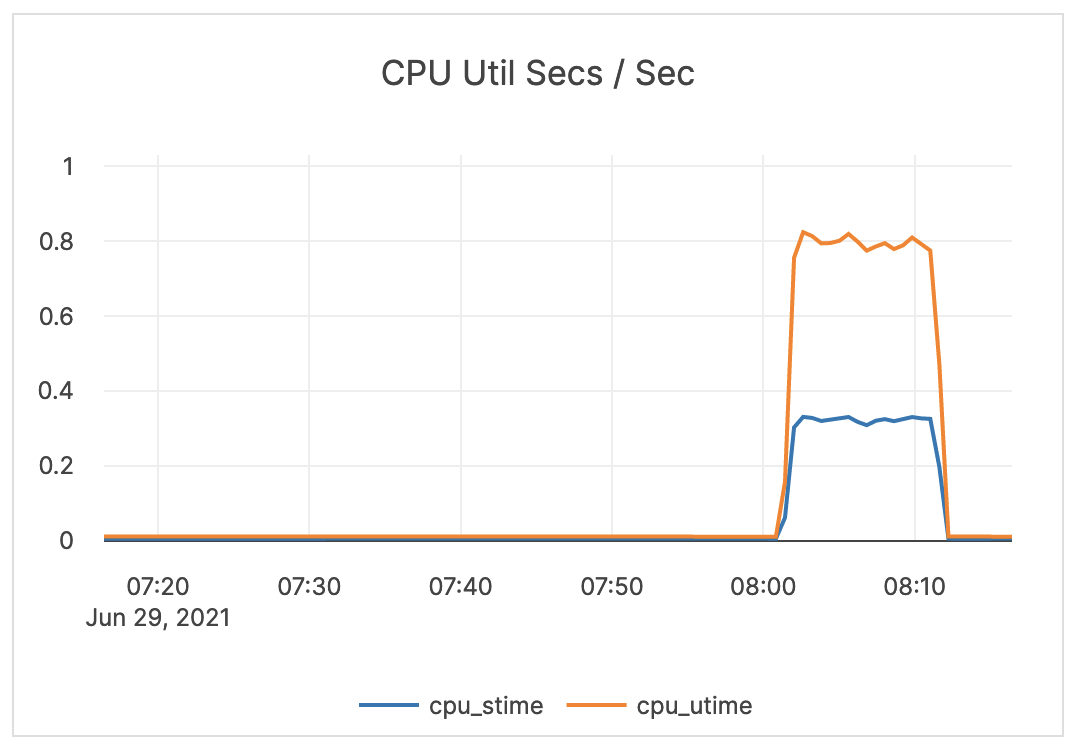 |
| Inbound RPC Connections Alive | The count of active connections to T-Servers. | This metric is informational and should not be subject to alerting. You may consider this information while examining alerts on other metrics. | 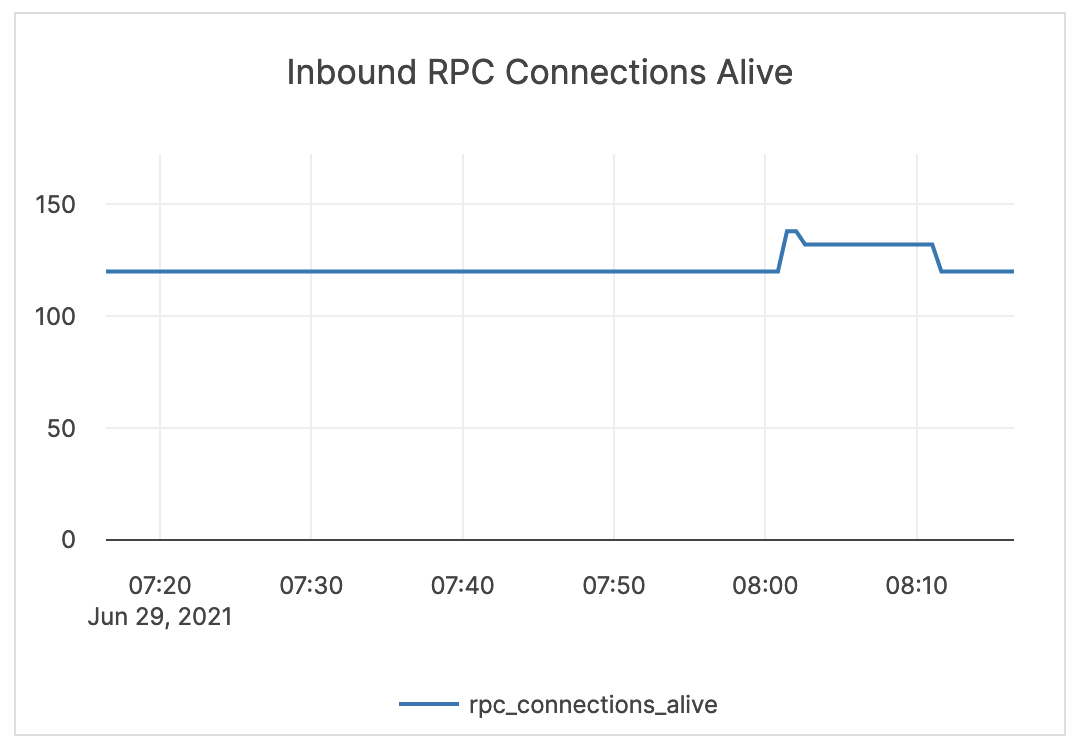 |
Master server
| Graph | Description | Alert Guidance | Example |
|---|---|---|---|
| Overall RPCs / sec | The number of created RPC inbound calls to the master servers. | The limit is 1000 TPS on the master, but under normal circumstances this number should be much lower than the limit. It is recommended to issue an alert at a range under the limit, yet higher than your average. |
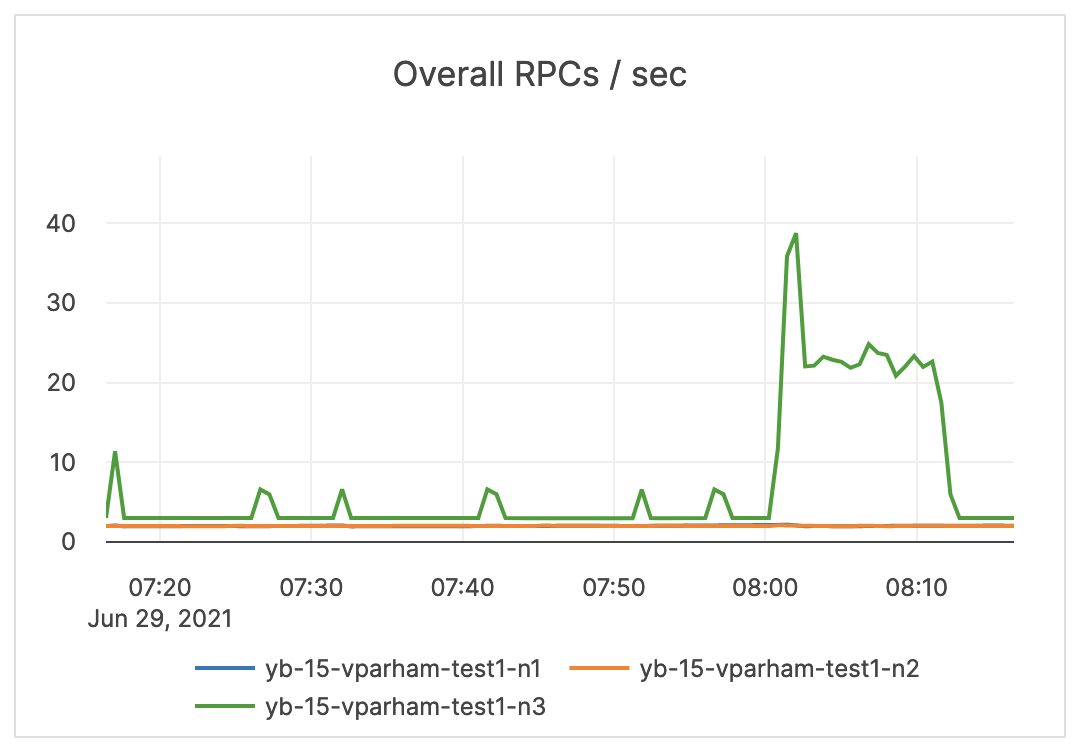 |
| GetTabletLocations / sec | The number of times the locations of the replicas for a given tablet were fetched from the master servers. | This metric is informational and should not be subject to alerting. You may consider this information while examining alerts on other metrics. | 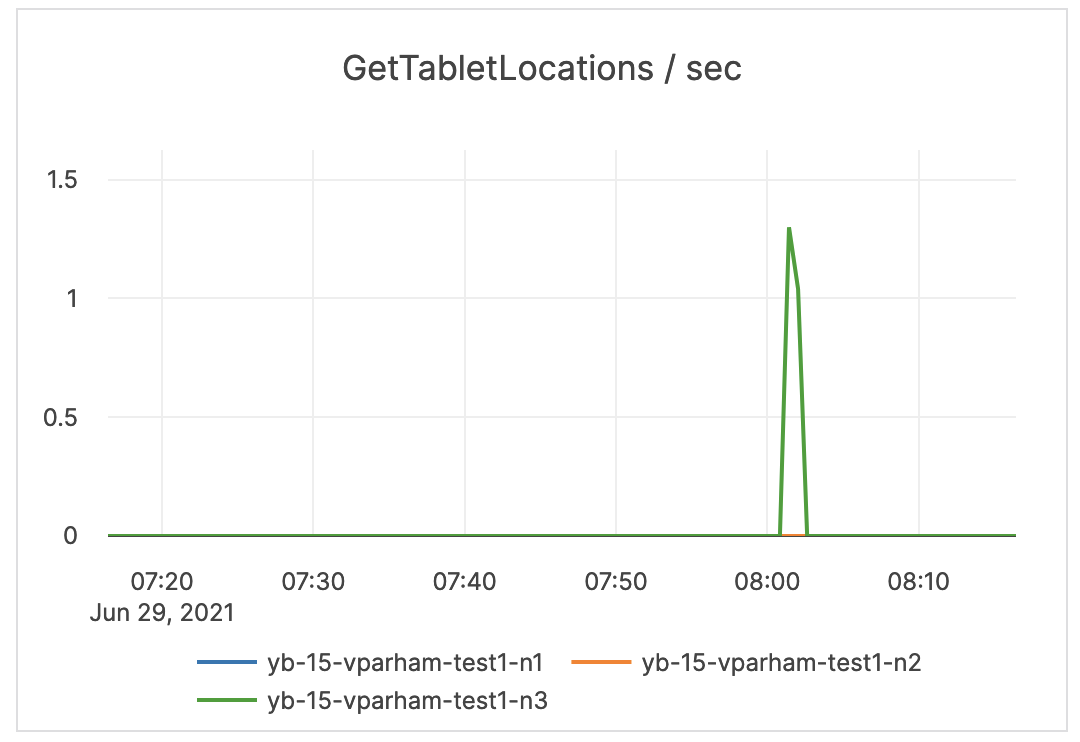 |
| Master TSService Reads / sec | The measure of YSQL reads of the Postgres system tables. | This metric is informational and should not be subject to alerting. You may consider this information while examining alerts on other metrics. | 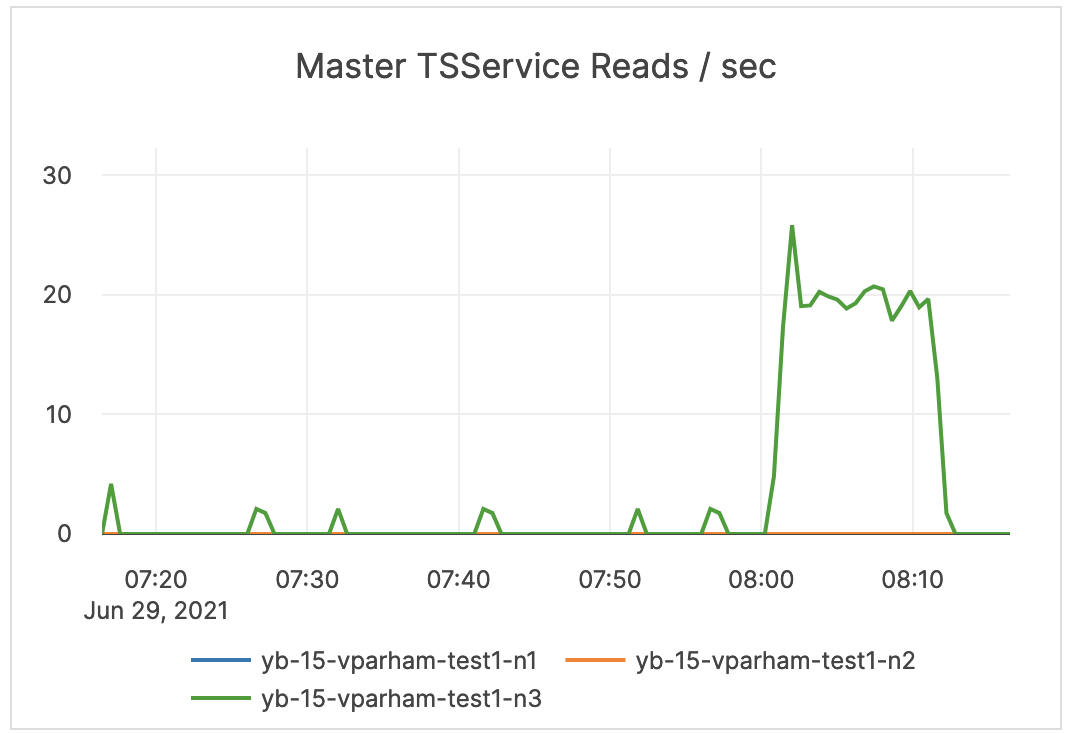 |
| Master TSService Writes / sec | The measure of YSQL writes to the Postgres system tables (during DDL). | This metric is informational and should not be subject to alerting. You may consider this information while examining alerts on other metrics. |  |
| TS Heartbeats / sec | The count of heartbeats received by the master server leader from the tablet servers. This establishes liveness and reports back any status changes. | This measure can be used to determine which master is the leader, since only the leader gets active heartbeats. | 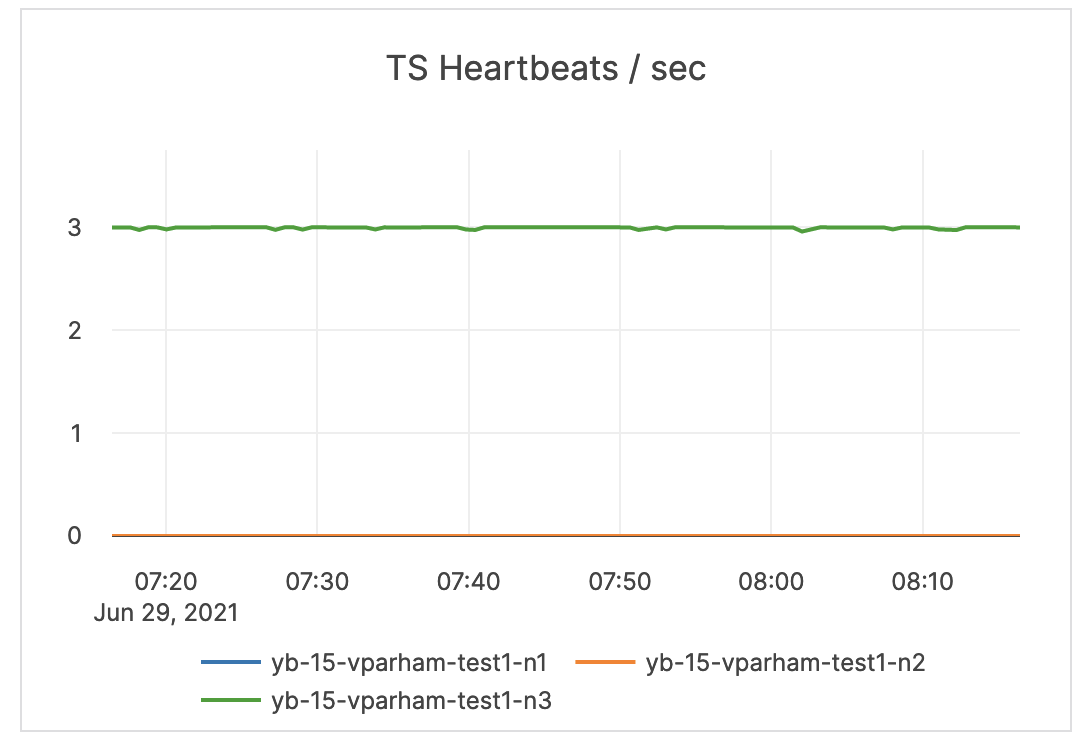 |
| RPC Queue Size | The mumber of RPCs in a service queue for master servers. | The queue size is an indicator of the incoming traffic. This metric is informational and should not be subject to alerting. You may consider this information while examining alerts on other metrics. |
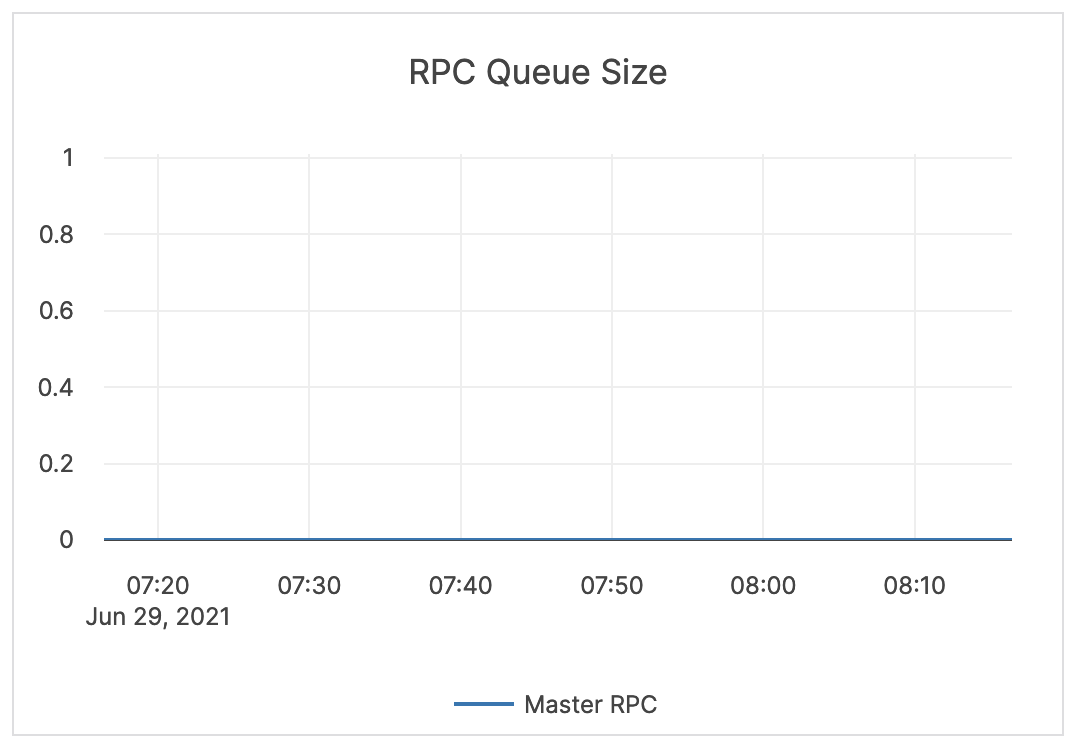 |
| UpdateConsensus / sec | Information pending | This metric is informational and should not be subject to alerting. You may consider this information while examining alerts on other metrics. | 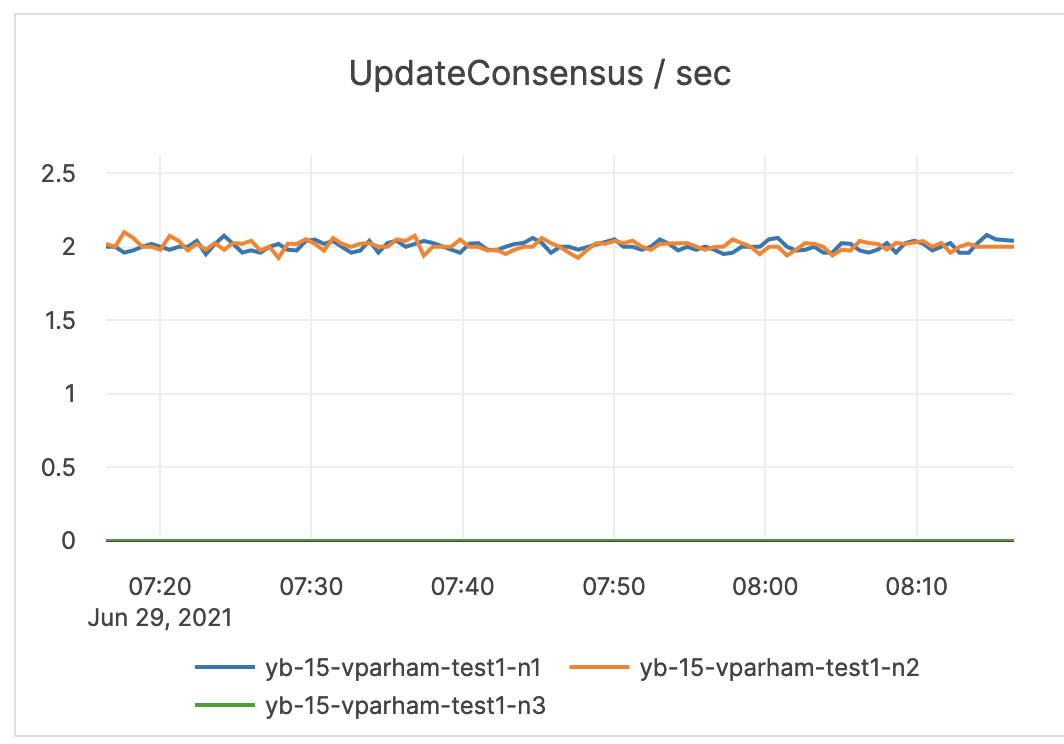 |
| Create / Delete Table RPCs | The count of administrative operations CreateTable and DeleteTable. | A deletion can fail when other operations, such as bootstrap, are running. This uses a configured retry timeout. | 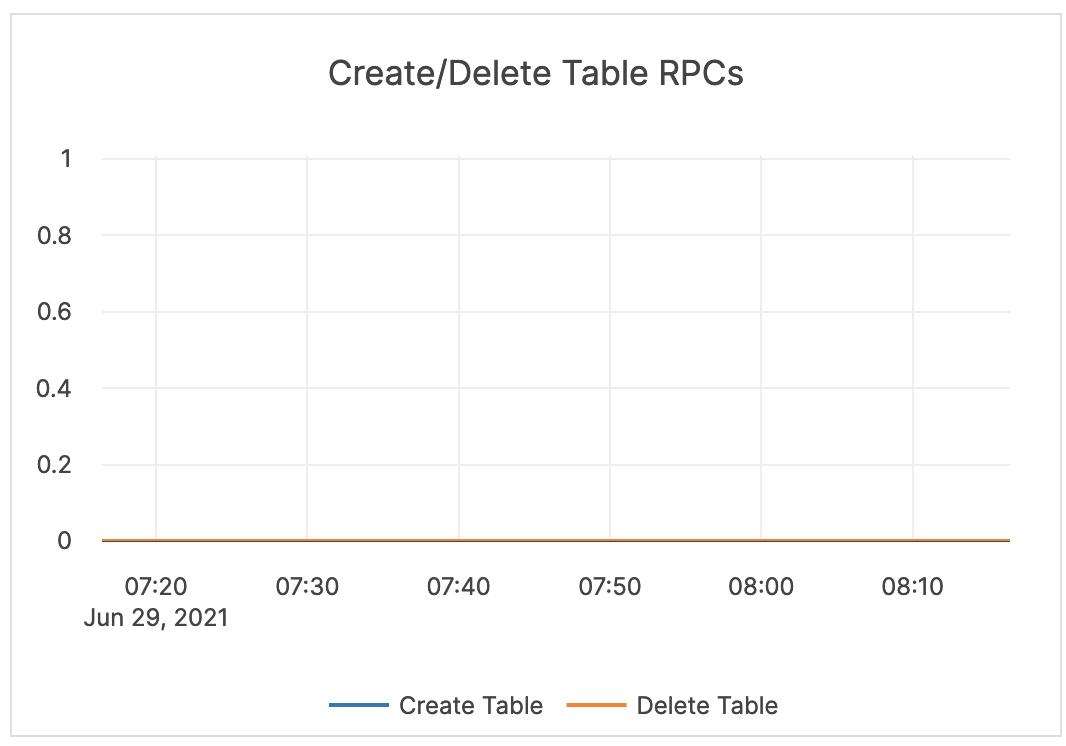 |
| CPU Util Secs / Sec (Master Server) | The master server CPU utilization. | The master server should not use a full CPU. | 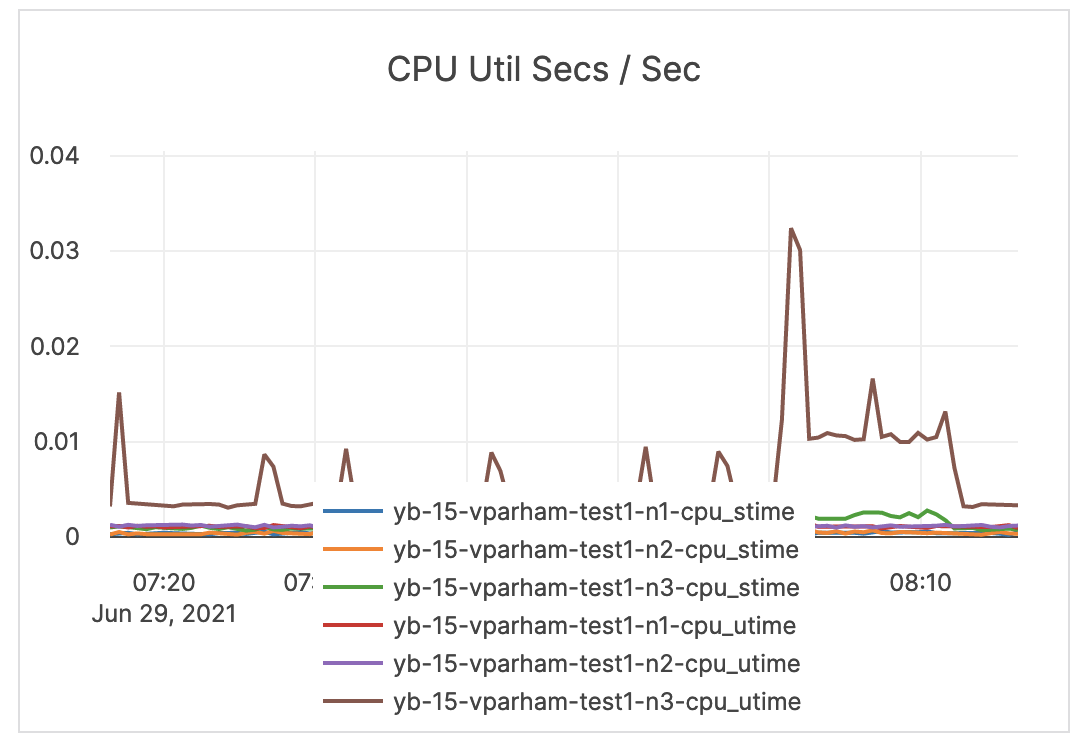 |
| Inbound RPC Connections Alive | The count of active connections to master servers. | This metric is informational and should not be subject to alerting. You may consider this information while examining alerts on other metrics. | 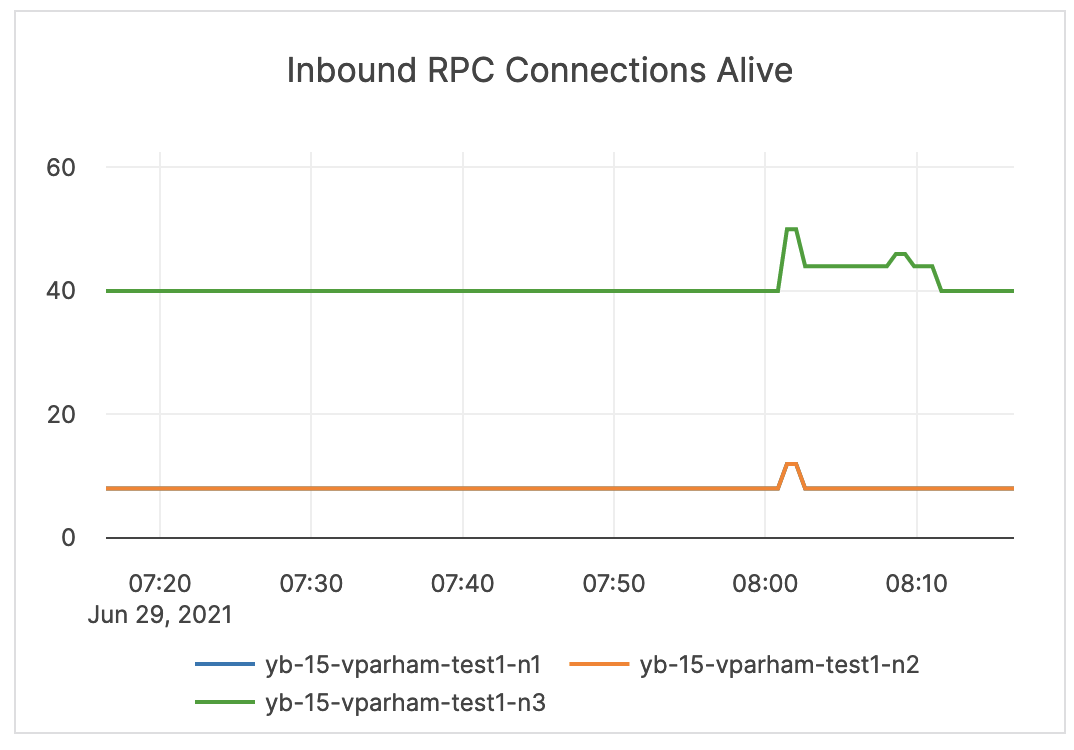 |
DocDB
DocDB uses a highly customized version of RocksDB, a log-structured merge tree (LSM)-based key-value store. The majority of the following metrics are used internally by engineers when troubleshooting a deployment, and, therefore, should not be subject to alerting.
| Graph | Description | Alert Guidance | Example |
|---|---|---|---|
| LSM-DB Seek / Next Num Ops | The number of calls to seek / next. | Alerting is not required. | 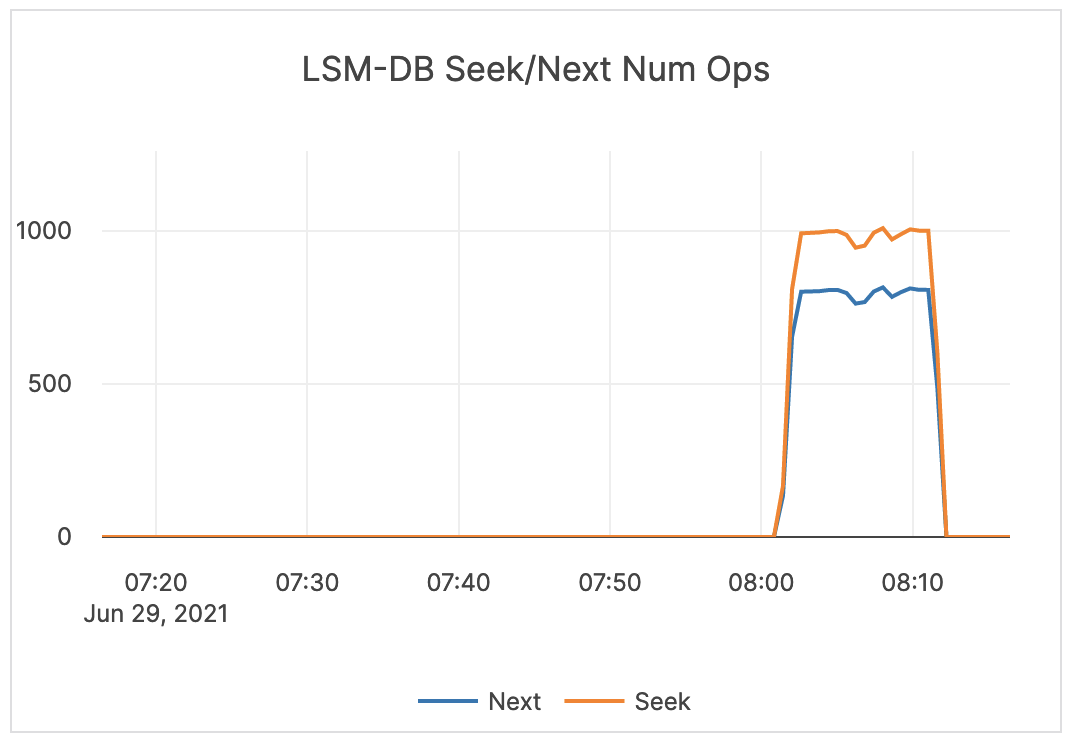 |
| LSM-DB Seeks / Sec / Node | The number of calls to seek per second per node. | Alerting is not required. | 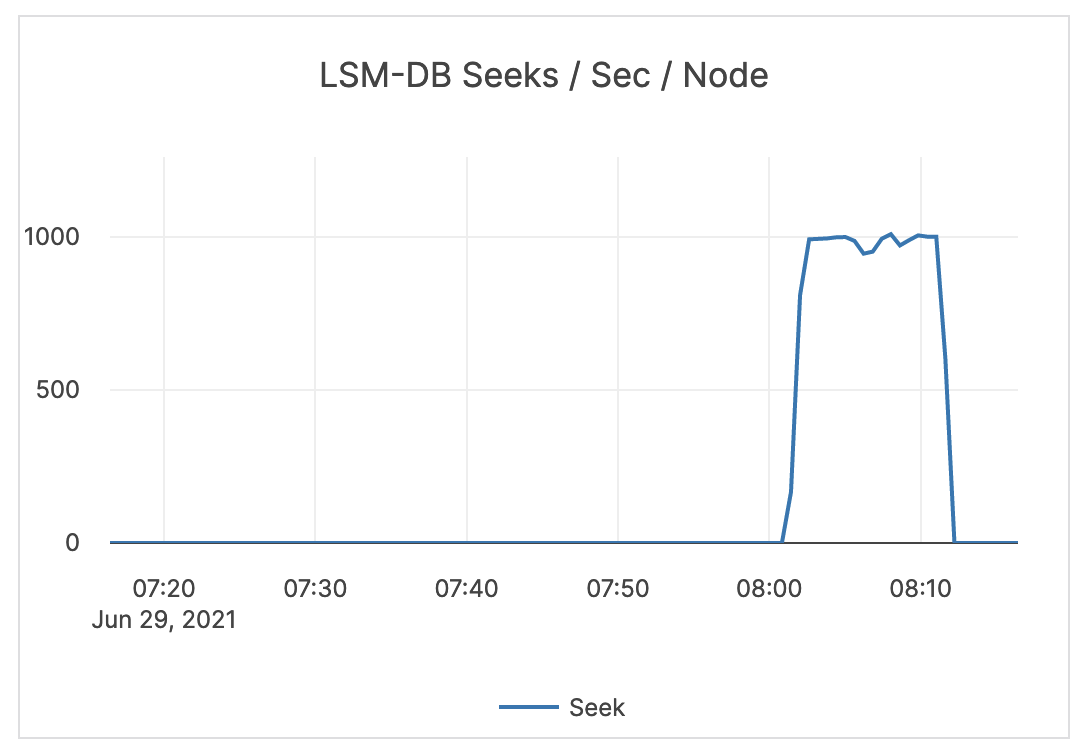 |
| SSTable size / Node | The size (in bytes) of all SST files. | Alerting is not required. | 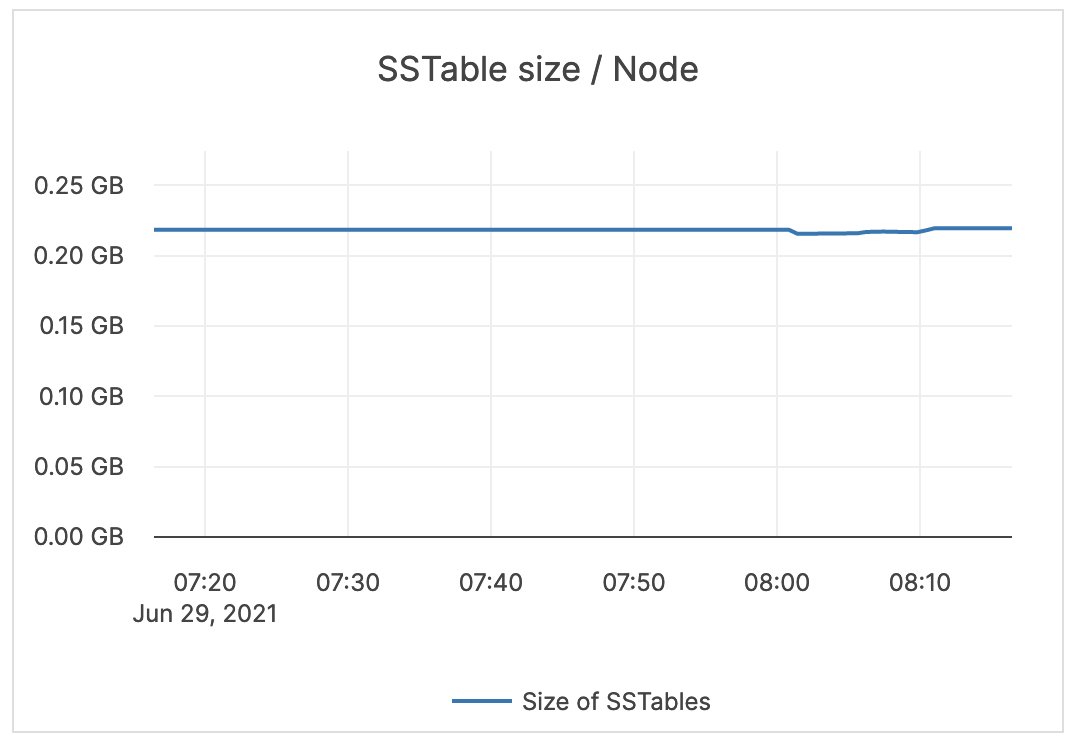 |
| Average SSTables / Node | The average number of SST files across nodes. | Alerting is not required. | 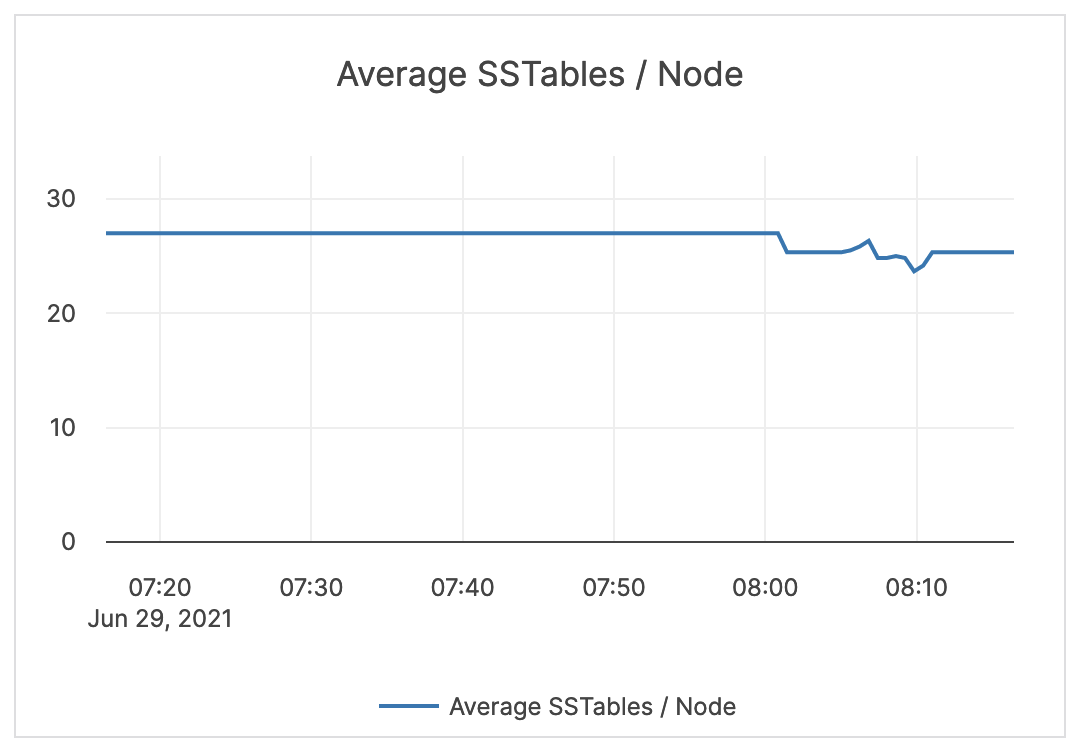 |
| LSM-DB Get Latencies | Latency in time (in microseconds) to retrieve data matching a value. | Alerting is not required. |  |
| LSM-DB Write Latencies | Latency in time (in microseconds) to write data. | Alerting is not required. | 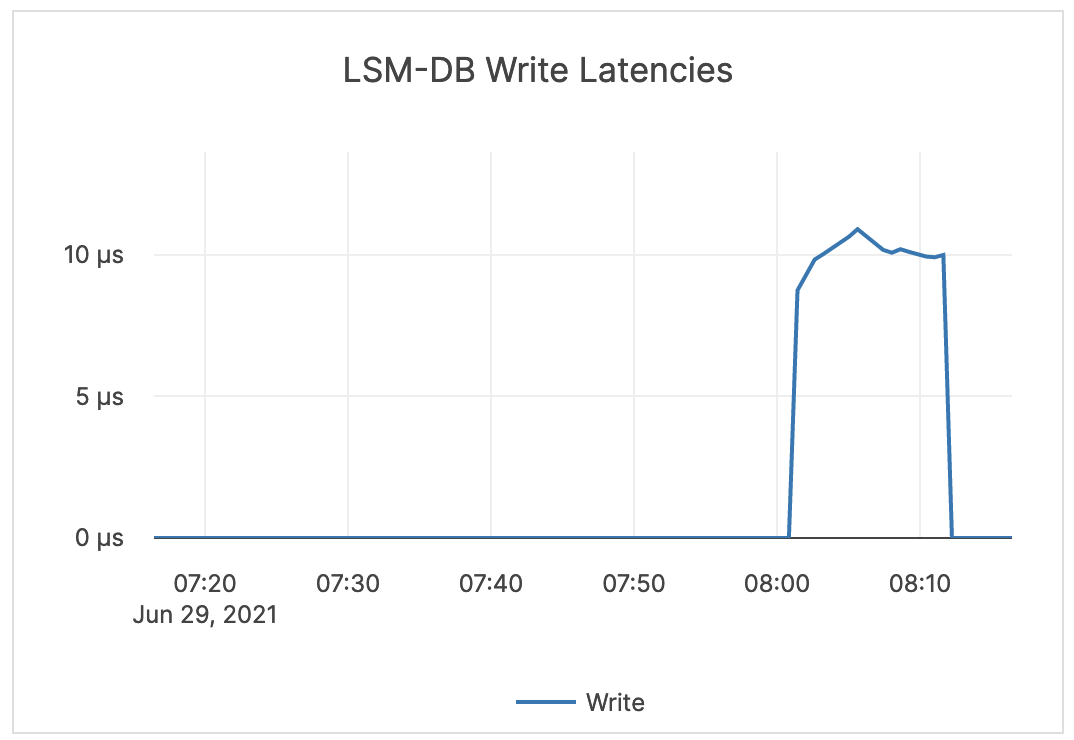 |
| LSM-DB Seek Latencies | Latency in time (in microseconds) to retrieve data in a range query. | Alerting is not required. | 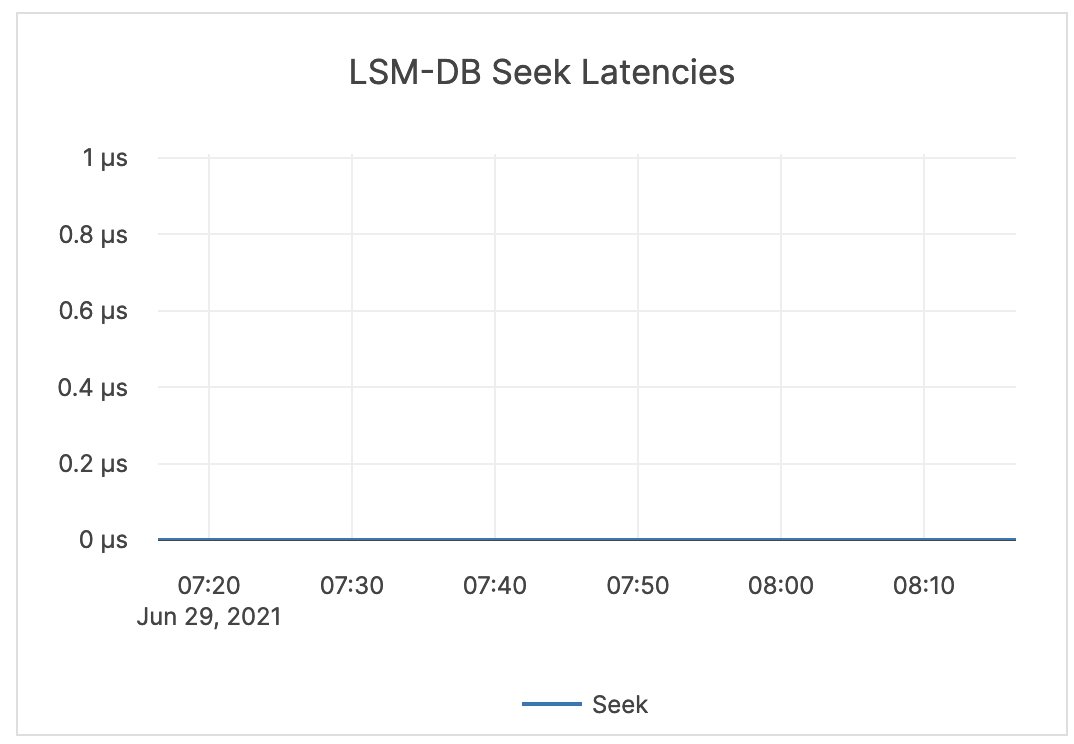 |
| LSM-DB Mutex Wait Latencies | The wait time (in microseconds) for the DB mutex. This mutex is held for meta operations, such as checking data structures before and after compactions or flushes. | Alerting is not required. |  |
| Cache Hit & Miss | Hit: the total number of block cache hits (cache index + cache filter + cache data). Miss: the total number of block cache misses (cache index + cache filter + cache data). |
If the number of misses is significant, it is recommended to issue an alert. | 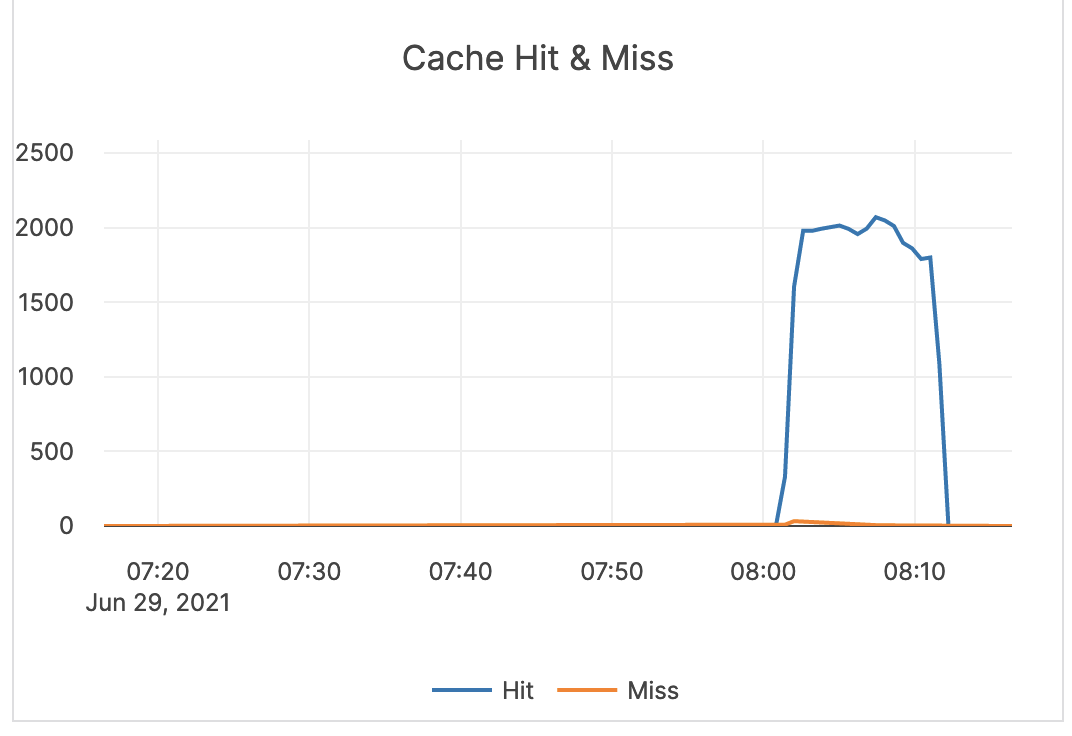 |
| Block cache usage | A block requires multiple touches before it is added to the multi-touch (hot) portion of the cache. Multi Touch: the size (in bytes) of the cache usage by blocks having multiple touches. Single Touch: the size (in bytes) of the cache usage by blocks having only a single touch. |
Alerting is not required. | 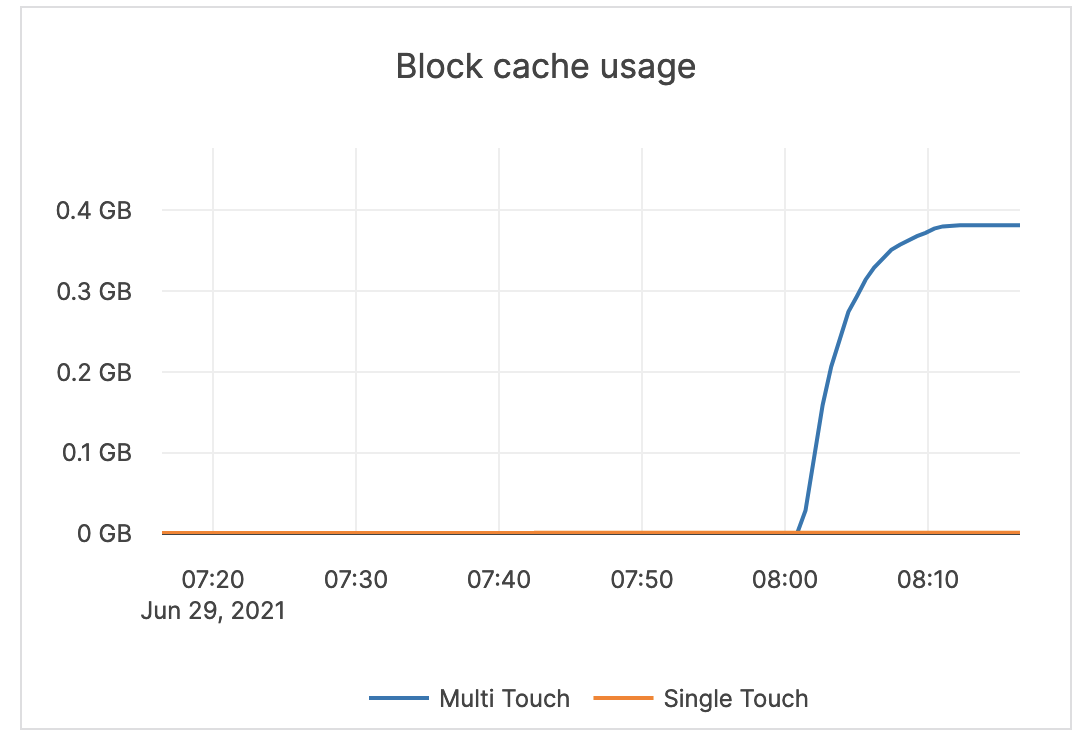 |
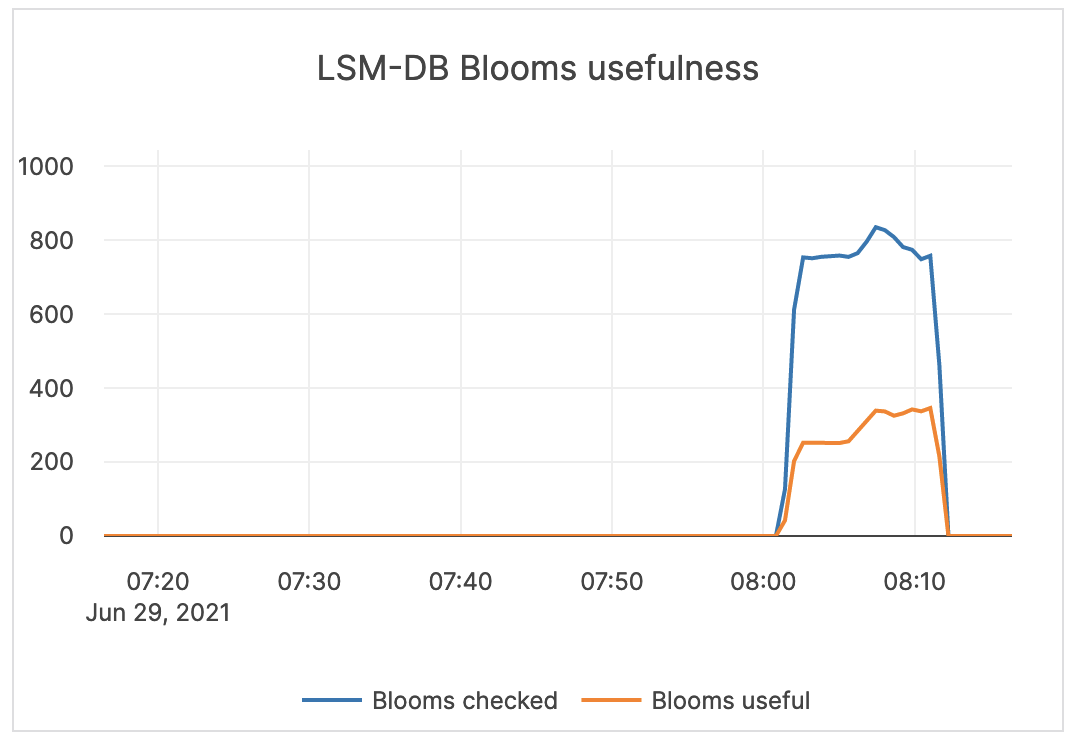
| LSM-DB Blooms usefulness | Blooms checked: the number of times the bloom filter has been checked. Blooms useful: the number of times the bloom filter has avoided file reads (avoiding iops). |
Bloom filters are hash tables used to determine if a given sstable has the data for a query looking for a particular value. Bloom filters are not helpful for range queries, and therefore alerting is not required. |
 |
| Stalls | Time (in microseconds or milliseconds) the writer has to wait for compactions or flushes to finish. | Alerting is not required | 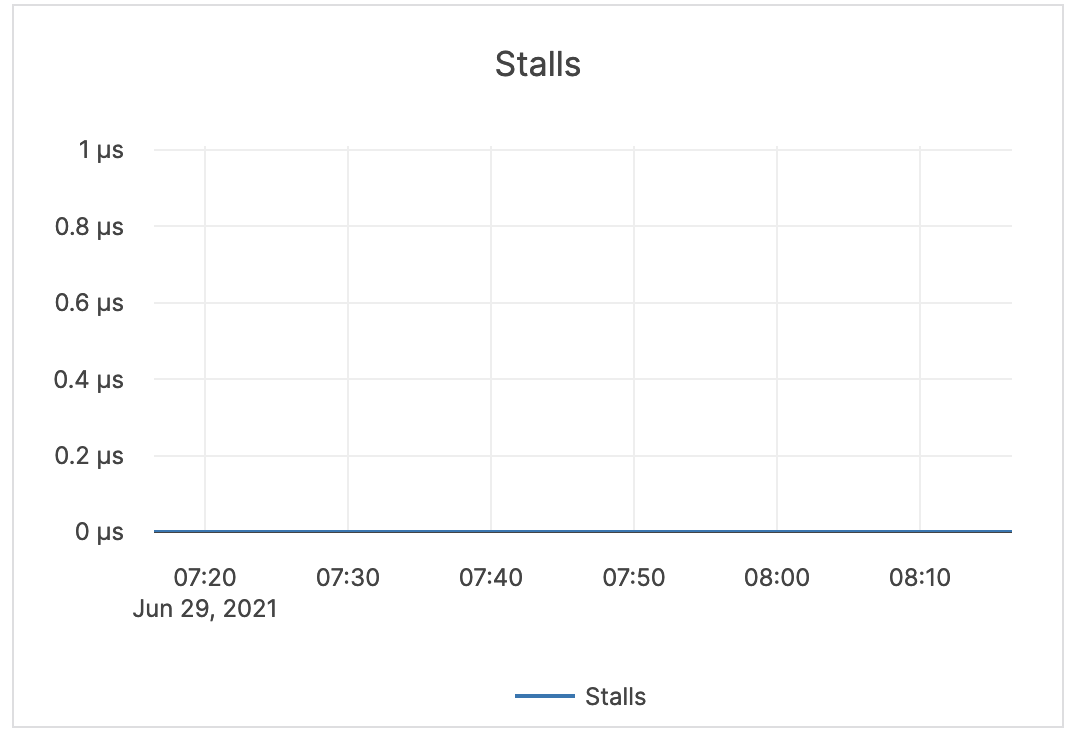 |
| Rejections | The number of RPC requests rejected due to the number of majority SST files. | Rejections can happen due to hitting the soft limit on SST files, hitting more than the soft memory limit (set to 85% of the hard limit), and so on. Alerting is not required. |
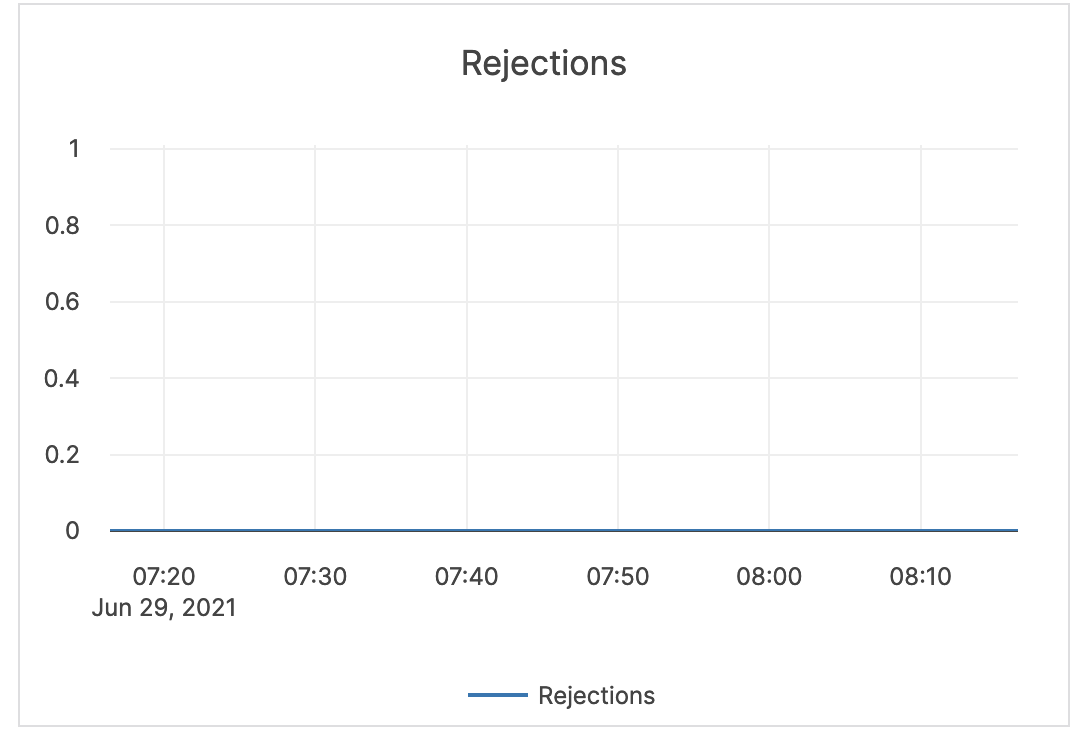 |
| Flush write | The number of bytes written during the flush process. | Alerting is not required. | 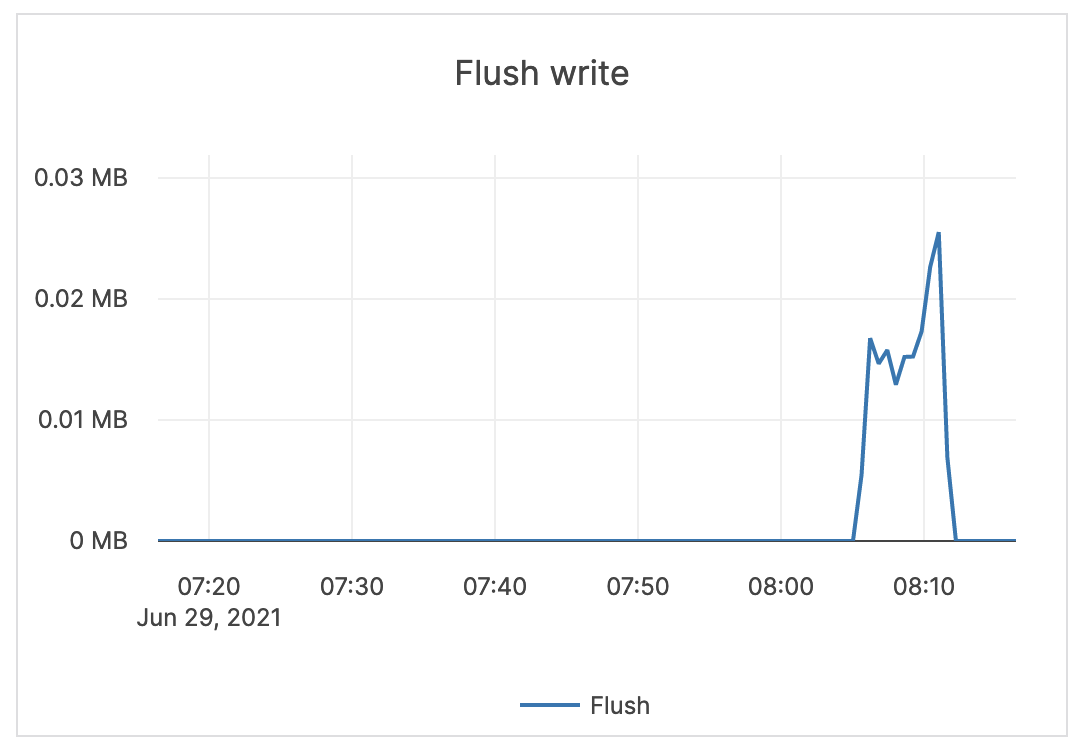 |
| Compaction | The number of bytes being read and written to do compaction. If not a lot of data is being deleted, these levels are similar. In some cases, you might see a large delete indicated by large reads but low writes afterwards (because a large percentage of data was removed in compaction). | Alerting is not required. | 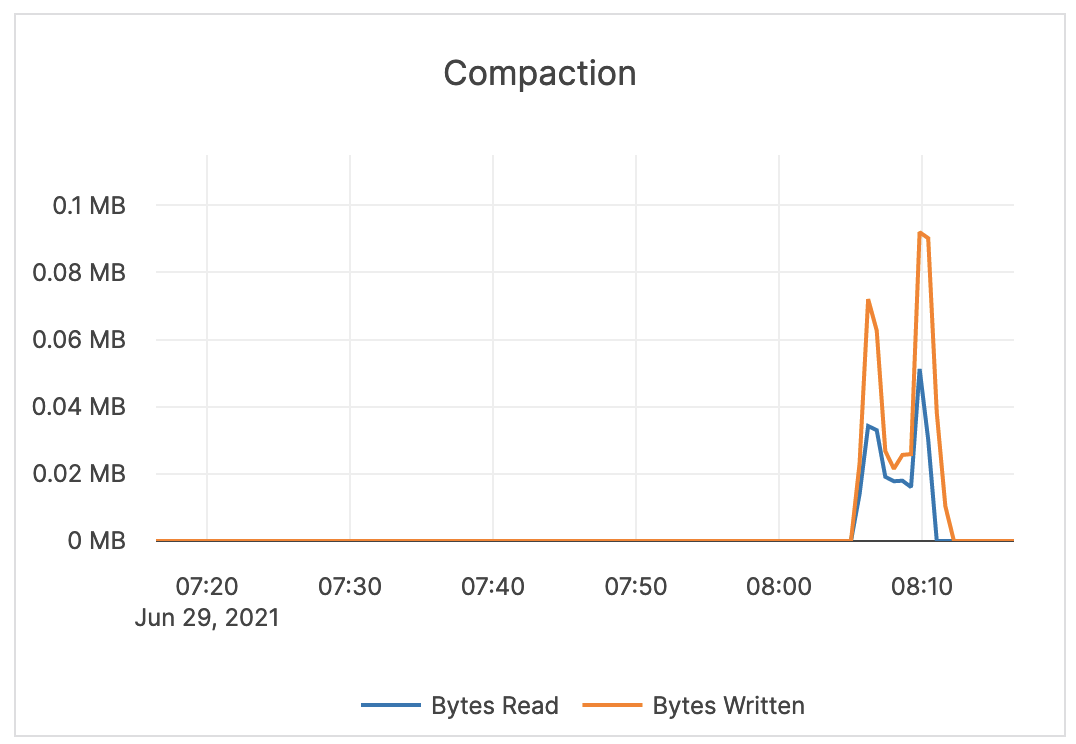 |
| Compaction time | Time (in milliseconds) for the compaction processes to complete. | Alerting is not required. | 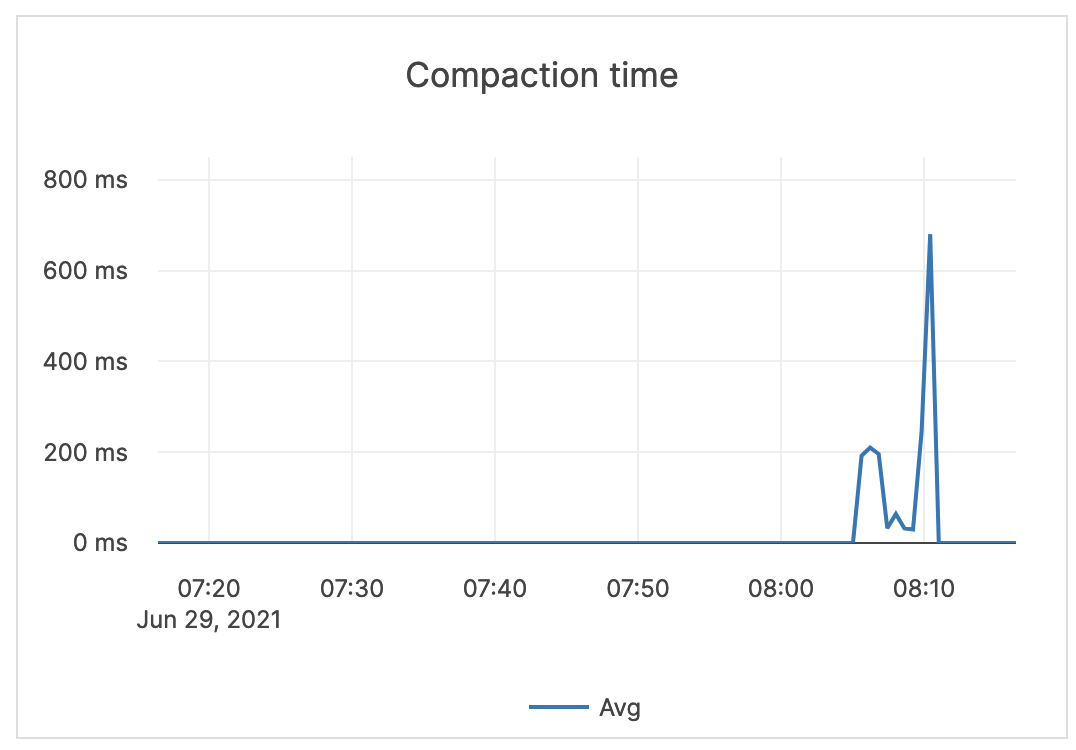 |
| Compaction num files | The average number of files in any single compaction. | This metric is informational and should not be subject to alerting. You may consider this information while examining alerts on other metrics. | 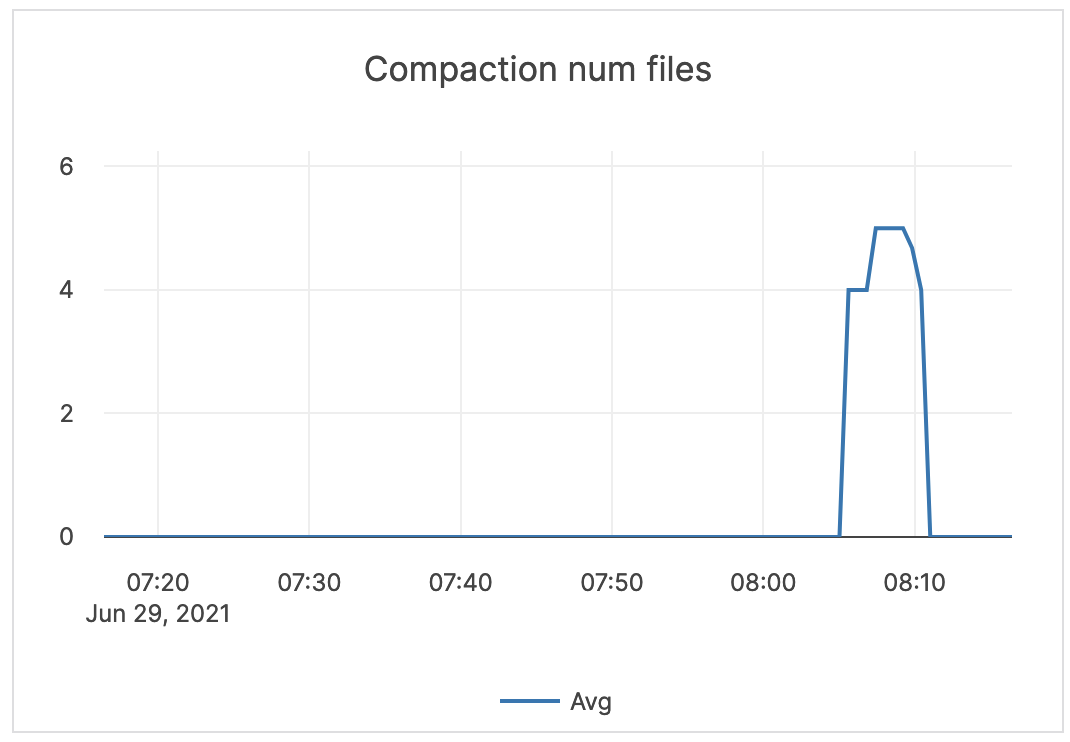 |
| Transaction | Expired Transactions: the number of expired distributed transactions. Transaction Conflicts: the number of conflicts detected among uncommitted distributed transactions. This is related to the process that resolves conflicts for write transactions. This process reads all intents that could conflict and tries to abort transactions with a lower priority. If a write transaction conflicts with a higher-priority transaction, then an error is returned and this metric is iterated. |
Alerting is not required. | 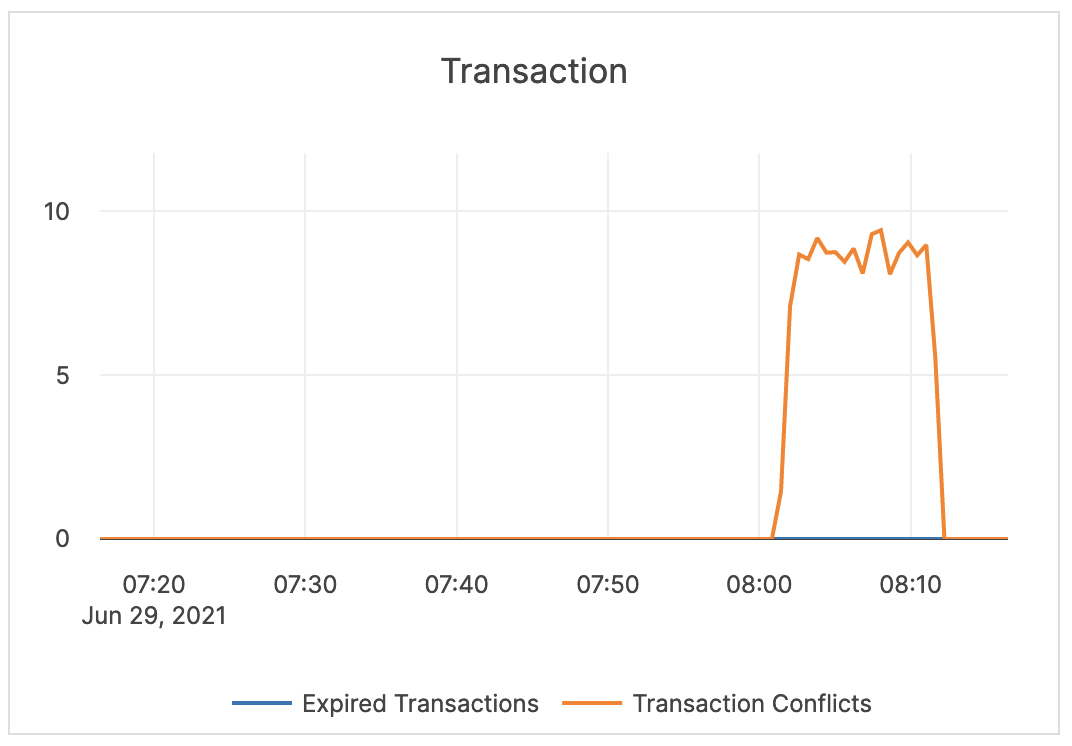 |
Replication
| Graph | Description | Alert Guidance | Example |
|---|---|---|---|
| Async Replication Lag | The maximum lag (in milliseconds) across all tables in an xCluster replication deployment. This time represents a delay from a Producer universe to a Consumer universe. The value of this metric is only shown on the Producer universe, unless there is a bi-directional replication. |
This metric is informational and should not be subject to alerting. You may consider this information while examining alerts on other metrics. | Example pending |
Command-line access to metrics
YugabyteDB Anywhere allows you to access all metrics via the command-line interface (CLI). These metrics include those not available from the Dashboard.
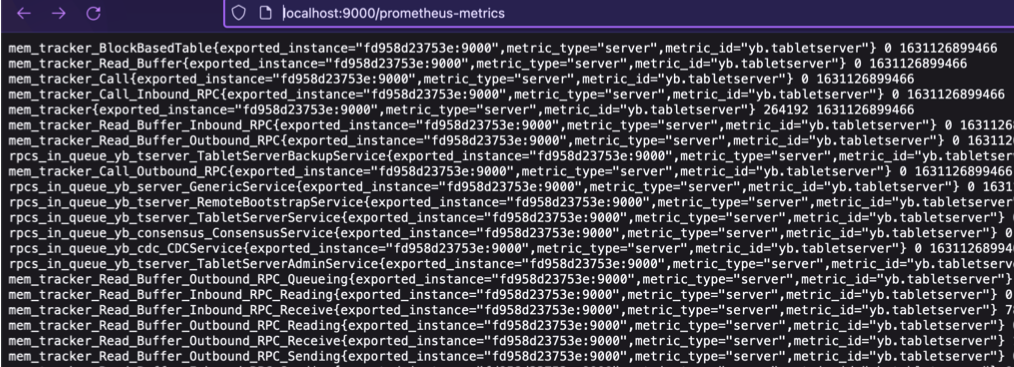
You can view T-Server and master server metrics in Prometheus and JSON formats in the browser or via the CLI using curl commands.
The following is the Prometheus command for the T-Server:
curl <node_IP>:9000/prometheus-metrics
Expect an output similar to the following:
The following is the Prometheus command for the master server:
curl <node_IP>:7000/prometheus-metrics
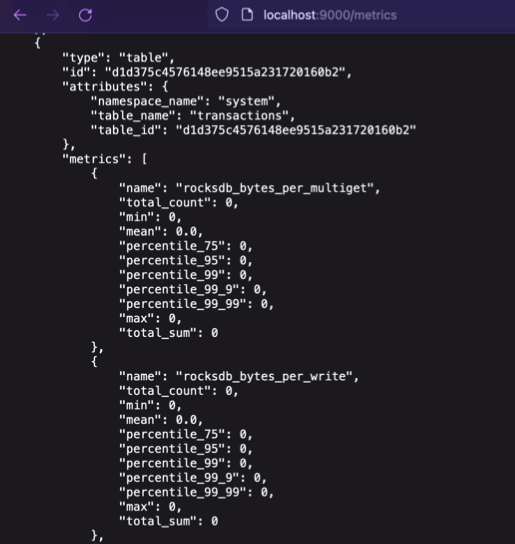
The following is the JSON command for the T-Server:
curl <node_IP>:9000/metrics
Expect an output similar to the following:
The following is the JSON command for the master server:
curl <node_IP>:7000/metrics
You can obtain additional information if you request the schema in the metrics URL, as follows:
curl <node_IP>:9000/metrics?include_schema=true
curl <node_IP>:7000/metrics?include_schema=true
The output would be similar to the following:
[
    {
        "type": "tablet",
        "id": "aaec98a6a44a418999f325d637f9e8cf",
        "attributes": {
            "partition": "hash_split: [0xBFFA, 0xDFF9)",
            "namespace_name": "mykeyspace",
            "table_name": "foo",
            "table_id": "63e3fee5f5f441eeb5a5071ebd64c232"
        },
        "metrics": [
            {
                "name": "mem_tracker_log_cache",
                "label": "Memory consumed by log_cache-aaec98a6a44a418999f325d637f9e8cf->log_cache->server->root",
                "type": "gauge",
                "unit": "bytes",
                "description": "Memory consumed by log_cache-aaec98a6a44a418999f325d637f9e8cf->log_cache->server->root",
                "level": "info",
                "value": 0
            },
            {
                "name": "mem_tracker_RegularDB_MemTable",
                "label": "Memory consumed by MemTable->RegularDB->tablet-aaec98a6a44a418999f325d637f9e8cf->Tablets->server->root",
                "type": "gauge",
                "unit": "bytes",
                "description": "Memory consumed by MemTable->RegularDB->tablet-aaec98a6a44a418999f325d637f9e8cf->Tablets->server->root",
                "level": "info",
                "value": 2048
            },
...
You can also federate metrics from YugabyteDB Anywhere and configure alerting rules to trigger alerts in Prometheus. For details, see the following sections of Alerts and Notifications in YugabyteDB Anywhere:
- Scrape metrics from YugabyteDB Anywhere
- Configurable alerting rules
Use nodes status
You can check the status of the master and T-Server on each YugabyteDB node by navigating to Universes > Universe-Name > Nodes, as per the following illustration:
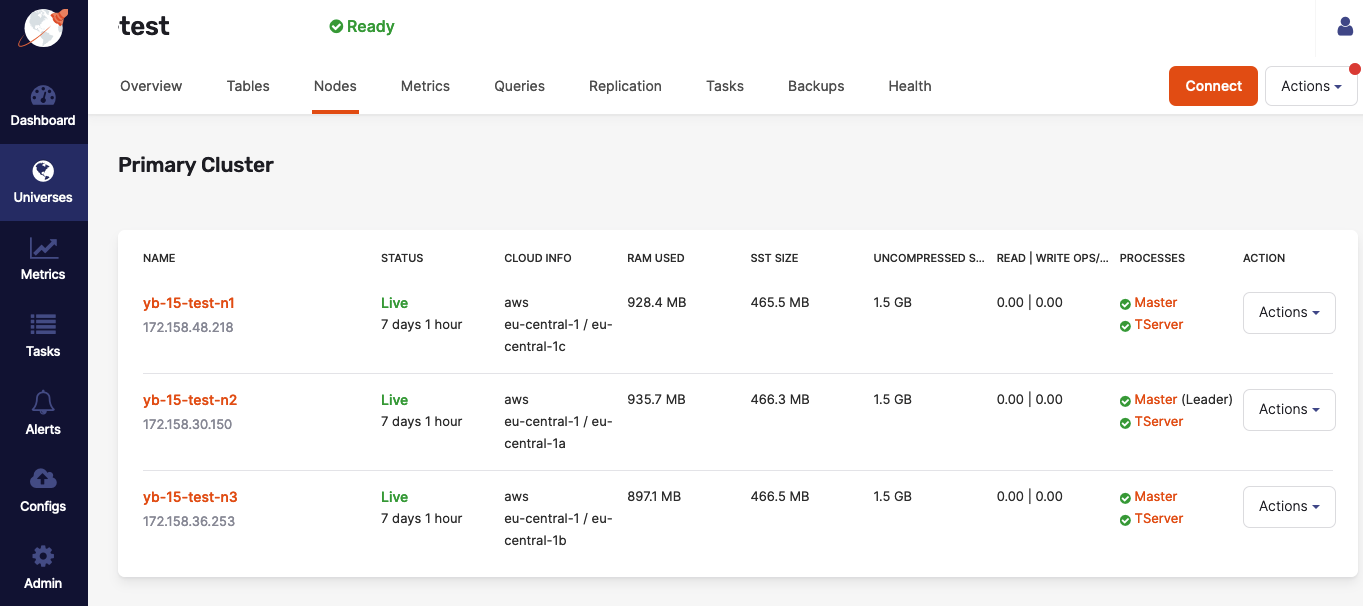
If issues arise, additional information about each master and TServer is available on their respective Details pages, or by accessing <node_IP>:7000 for master servers and <node_IP>:9000 for T-Servers (unless the configuration of your on-premises data center or cloud-provider account prevents the access, in which case you may consult Checking YugabyteDB Servers.
Check host resources on the nodes
To check host resources on your YugabyteDB nodes, run the following script, replacing the IP addresses with the IP addresses of your YugabyteDB nodes:
for IP in 10.1.13.150 10.1.13.151 10.1.13.152; \
do echo $IP; \
  ssh $IP \
    'echo -n "CPUs: ";cat /proc/cpuinfo | grep processor | wc -l; \
      echo -n "Mem: ";free -h | grep Mem | tr -s " " | cut -d" " -f 2; \
      echo -n "Disk: "; df -h / | grep -v Filesystem'; \
done
The output should look similar to the following:
10.1.12.103
CPUs: 72
Mem: 251G
Disk: /dev/sda2       160G   13G  148G   8% /
10.1.12.104
CPUs: 88
Mem: 251G
Disk: /dev/sda2       208G   22G  187G  11% /
10.1.12.105
CPUs: 88
Mem: 251G
Disk: /dev/sda2       208G  5.1G  203G   3% /
Troubleshoot universe creation
You typically create universes by navigating to Universes > Create universe > Primary cluster, as per the following illustration:
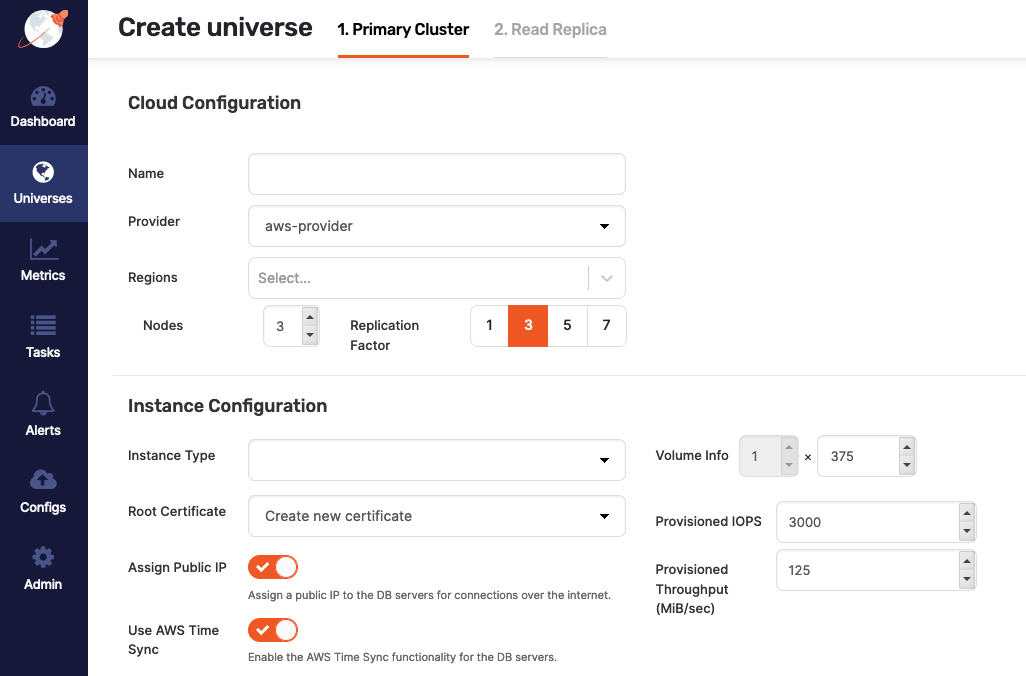
If you disable Assign Public IP during the universe creation, the process may fail under certain conditions, unless you either install the following packages on the machine image or make them available on an accessible package repository:
chrony, if you enabled Use Time Sync for the selected cloud provider.python-minimal, if YugabyteDB Anywhere is installed on Ubuntu 18.04.python-setuptools, if YugabyteDB Anywhere is installed on Ubuntu 18.04.python-sixorpython2-six(the Python2 version of Six).policycoreutils-python, if YugabyteDB Anywhere is installed on CentOS 7 or Oracle Linux 8.selinux-policymust be on an accessible package repository, if YugabyteDB Anywhere is installed on Oracle Linux 8.locales, if YugabyteDB Anywhere is installed on Ubuntu.
The preceding package requirements are applicable to YugabyteDB Anywhere version 2.13.1.0.
If you are using YugabyteDB Anywhere version 2.12.n.n and disable Use Time Sync during the universe creation, you also need to install the ntpd package.
Use support bundles
A support bundle is an archive generated at a universe level. It contains all the files required for diagnosing and troubleshooting a problem. The diagnostic information is provided by the following types of files:
- Application logs from YugabyteDB Anywhere.
- Universe logs, which are the Master and T-Server log files from each node in the universe.
- Output files (
.out) files generated by the Master and T-Server. - Error files (
.err) generated by the Master and T-Server. - G-flag configuration files containing the g-flags set on the universe.
- Instance files that contain the metadata information from the Master and T-Server.
- Consensus meta files containing consensus metadata information from the Master and T-Server.
- Tablet meta files containing the tablet metadata from the Master and T-Server.
The diagnostic information can be analyzed locally or the bundle can be forwarded to the Yugabyte Support team.
You can create a support bundle as follows:
-
Open the universe that needs to be diagnosed and click Actions > Support Bundles.
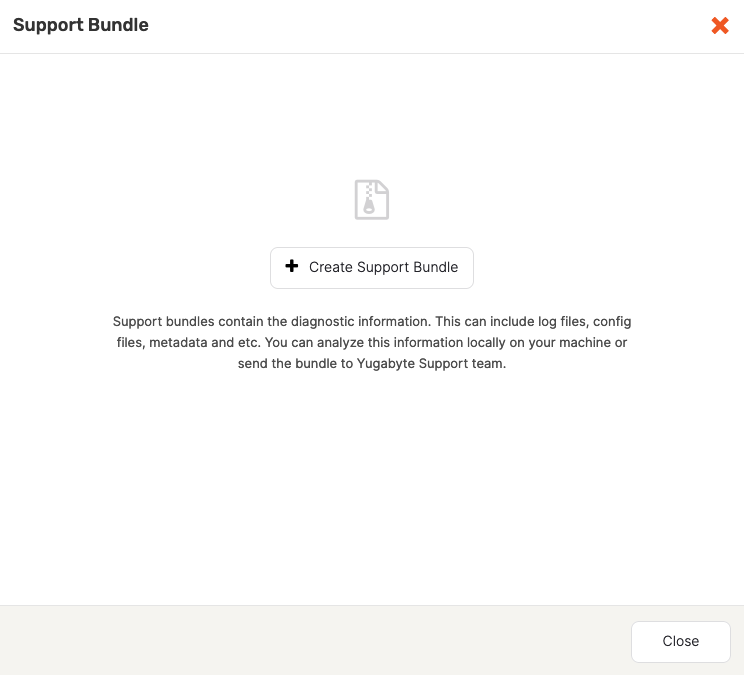
-
If the universe already has support bundles, they are displayed by the Support Bundle dialog. If there are no bundles for the universe, use the Support Bundles dialog to generate a bundle by clicking Create Support Bundle, as per the following illustration:
-
Select the date range and the types of files to be included in the bundle, as per the following illustration:
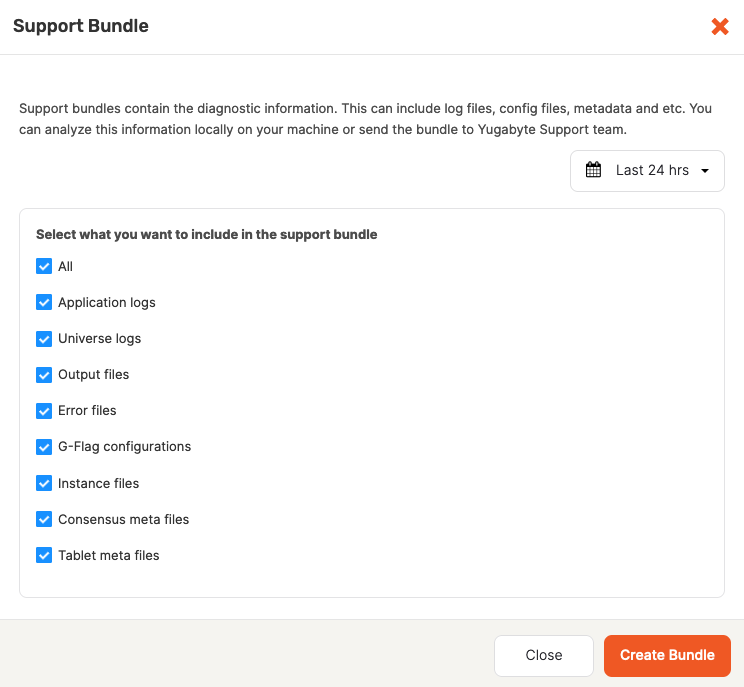
-
Click Create Bundle.
YugabyteDB Anywhere starts collecting files from all the nodes in the cluster into an archive. Note that this process might take several minutes. When finished, the bundle's status is displayed as Ready, as per the following illustration:
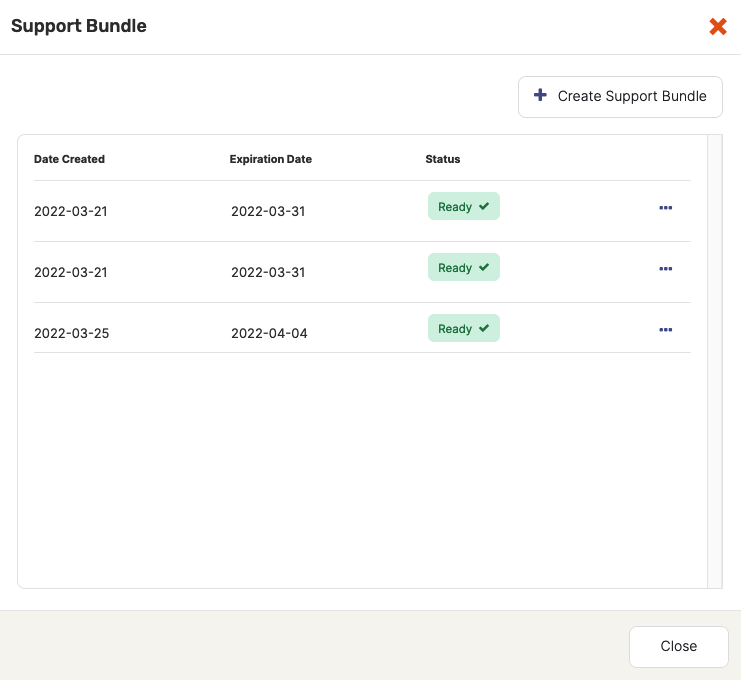
The Support Bundles dialog allows you to either download the bundle or delete it if it is no longer needed. By default, bundles expire after ten days to free up space.
Configure storage class volume binding
On Kubernetes, it is recommended to set volume binding mode on a StorageClass to WaitForFirstConsumer for dynamically provisioned volumes. This will delay provisioning until a pod using the persistent volume claim (PVC) is created. The pod topology or scheduling constraints will be respected. However, scheduling might fail if the storage volume is not accessible from all the nodes in a cluster and the default volume binding mode is set to Immediate for certain regional cloud deployments.
For more information, see Kubernetes: volume binding mode.
On Google Cloud Provider (GCP), if you choose not to set binding mode to WaitForFirstConsumer, you might use regional persistent disks to replicate data between two zones in the same region on Google Kubernetes Engine (GKE). This can be used by the pod, in cases when the pod reschedules to another node in a different zone.
For more information, see the following: