Alerts
Use alerts to notify you and your team members when cluster and database resource usage exceeds predefined limits, or of potential billing issues.
You configure alerts and notifications on the Alerts page.
To monitor clusters in real time, use the performance metrics on the cluster Overview and Performance tabs.
Features
-
YugabyteDB Managed sends email notifications to all account members.
-
When an alert triggers, YugabyteDB Managed sends an email notification once, regardless of how long the condition lasts.
-
When an alert triggers, a notification displays on the Notifications page. Once the alert condition resolves, the notification dismisses automatically.
-
Alerts are enabled for all clusters in your account.
-
Alerts can have two severity levels: Warning or Severe.
Configure alerts
Enable alerts using the Configurations tab on the Alerts page.
Only Admin users can configure billing alerts.
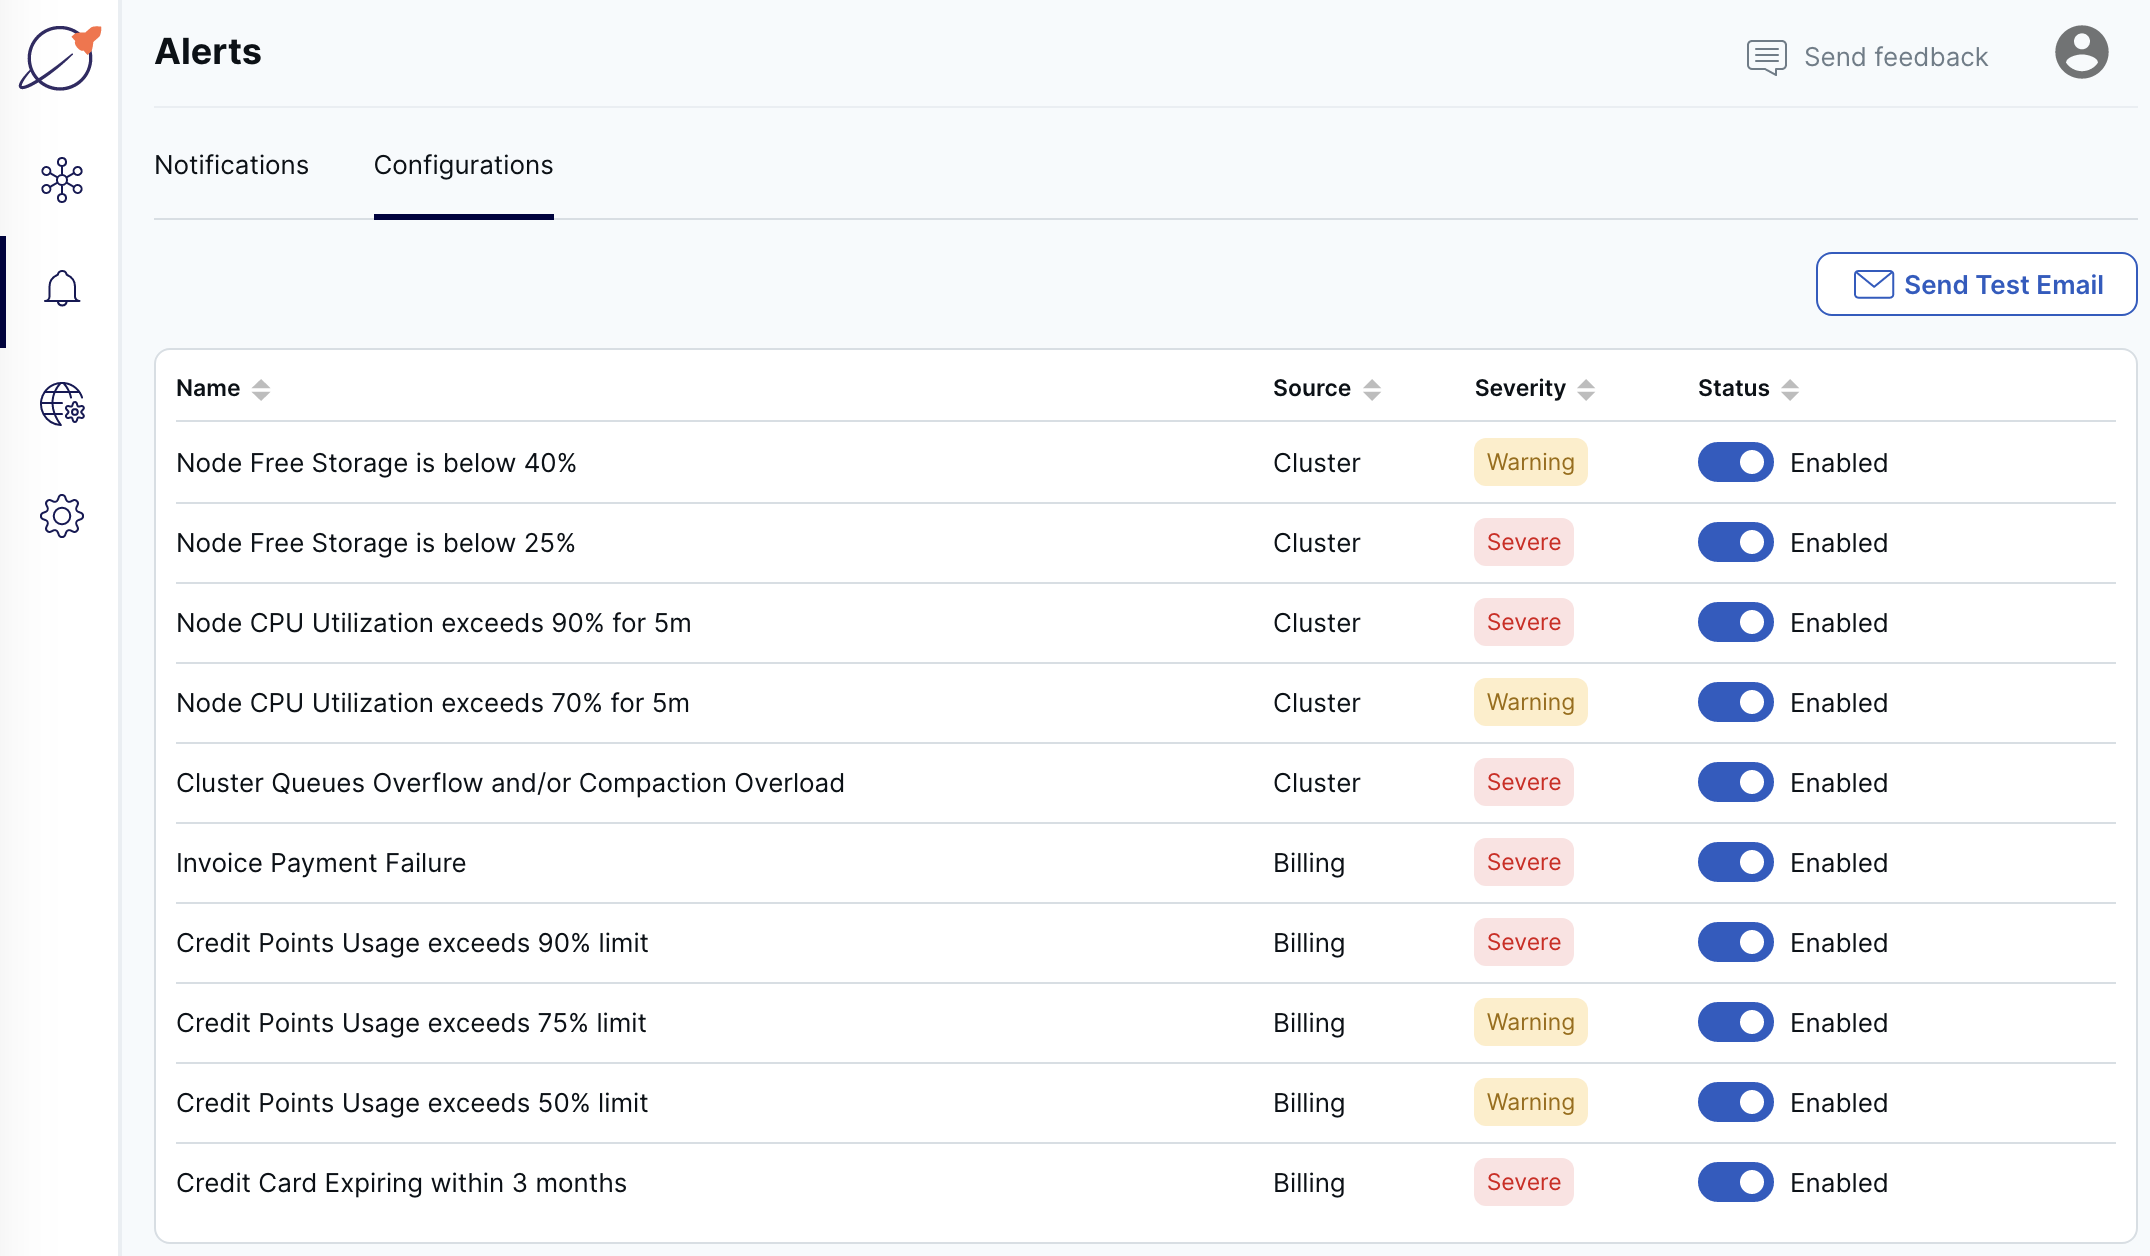
To change an alert, click the toggle in the Status column.
To test that you can receive email from the Yugabyte server, click Send Test Email.
Review notifications
Open notifications are listed on the Notifications tab on the Alerts page.
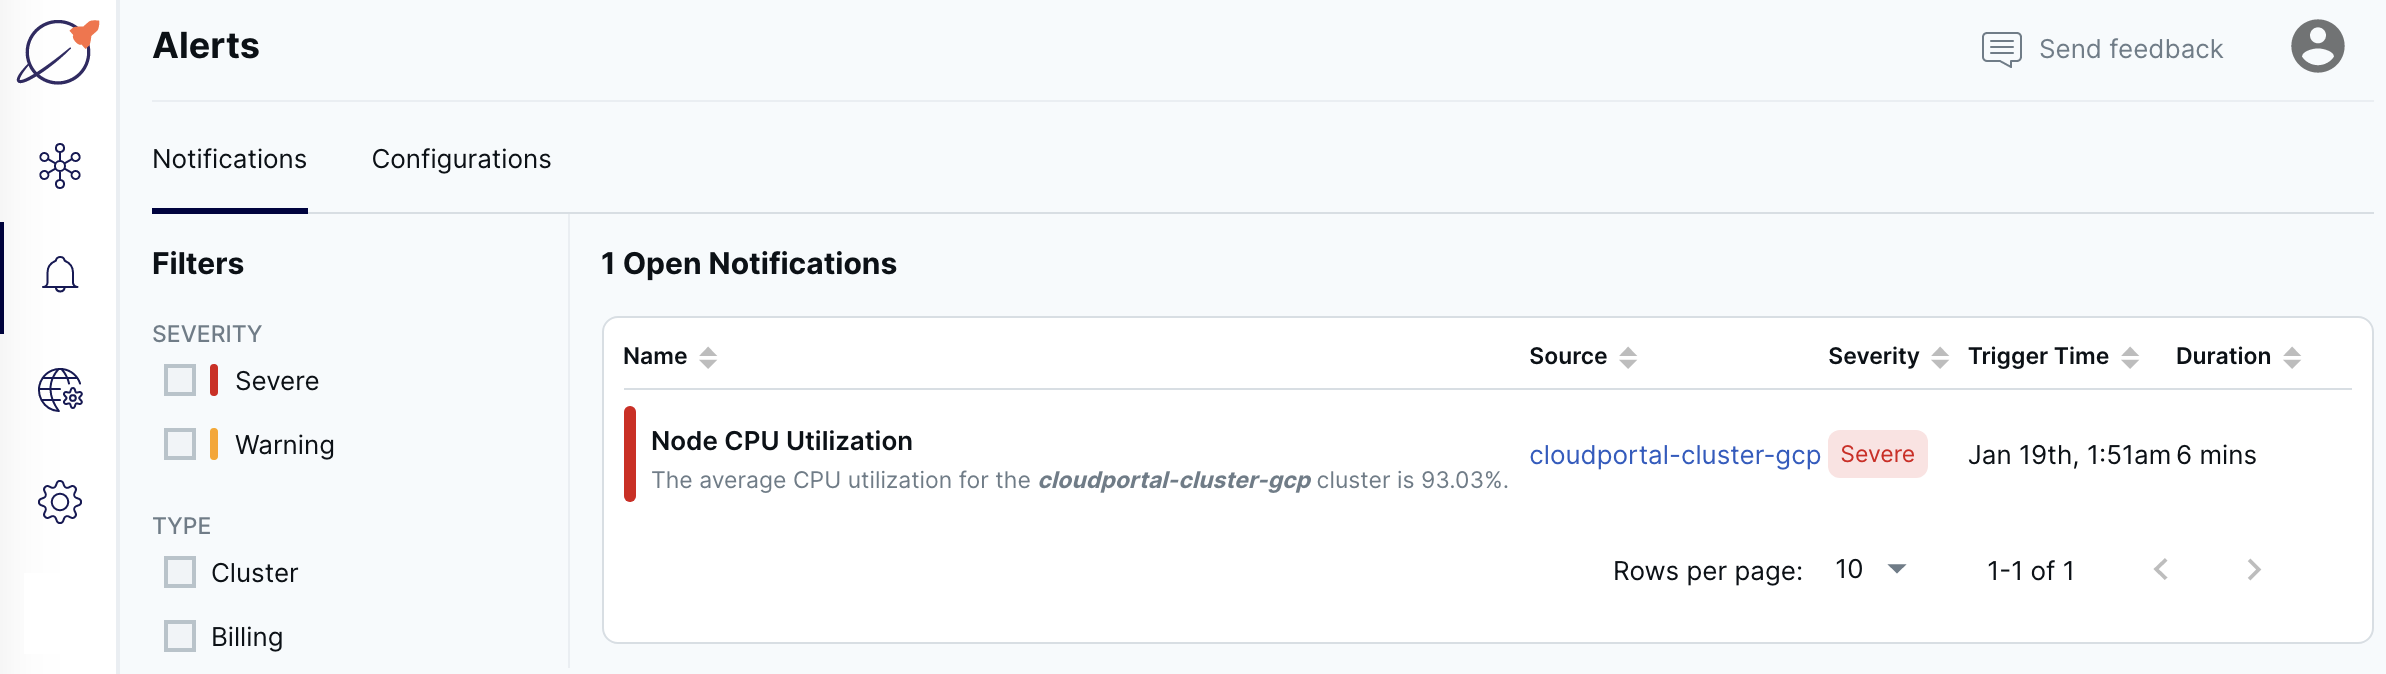
When the condition that caused the alert resolves, the notification dismisses automatically.
Fixing alerts
Alerts can trigger for issues with a particular cluster, or for billing issues.
Cluster alerts
When you receive a cluster alert, the first step is to review the chart for the metric over time to evaluate trends and monitor your progress. The following charts are available:
| Alert | Chart |
|---|---|
| Node CPU Utilization | CPU Usage |
| Node Free Storage | Disk Usage |
| Cluster Queues Overflow | RPC Queue Size |
| Compaction Overload | Compaction |
You can view the metrics on the cluster Performance tab. Refer to Performance metrics.
Note
If you get frequent cluster alerts on a Sandbox cluster, you may have reached the performance limits for Sandbox clusters. Consider upgrading to a Dedicated cluster.Fix storage alerts
YugabyteDB Managed sends a notification when the free storage on any node in the cluster falls below the threshold, as follows:
- Node free storage is below 40% (Warning).
- Node free storage is below 25% (Severe).
Once disk capacity falls below 25% for any node, look at your database for unused tables that you can truncate or drop.
Consider increasing the disk space per node. By default, you are entitled to 50GB per vCPU. Adding vCPUs also automatically increases disk space.
For information on scaling clusters, refer to Scale and configure clusters.
Fix CPU alerts
YugabyteDB Managed sends a notification when CPU use on any node in the cluster exceeds the threshold, as follows:
- Node CPU use exceeds 70% on average for at least 5 minutes (Warning).
- Node CPU use exceeds 90% on average for at least 5 minutes (Severe).
If your cluster experiences frequent spikes in CPU use, consider optimizing your workload.
Unoptimized queries can lead to CPU alerts. Use the Slow Queries and Live Queries views to identify potentially problematic queries, then use the EXPLAIN statement to see the query execution plan and identify optimizations. Consider adding one or more indexes to improve query performance. For more information, refer to Analyzing Queries with EXPLAIN.
High CPU use could also indicate a problem and may require debugging by Yugabyte Support.
If CPU use is continuously higher than 80%, your workload may also exceed the capacity of your cluster. Consider scaling your cluster by adding vCPUs. Refer to Scale and configure clusters.
Fix database overload alerts
YugabyteDB Managed sends the following database overload alert:
- Cluster queues overflow and/or compaction overload.
This alert triggers if any one of the following conditions occurs:
- The number of client requests that timed out waiting in the service queue is greater than 0 for 10 minutes. This can be caused by your application generating requests (such as queries and scans) at a rate faster than the database can process them.
- The number of client requests dropped because the service queue was full is greater than 0 for 10 minutes. This can be caused by your application generating requests (such as queries and scans) at a rate faster than the database can process them.
- The number of rejected compaction requests is greater than 0 for 10 minutes. This can be caused by running a high INSERT/ UPDATE/ DELETE workload on a cluster that is undersized.
Cluster queue overflow and compaction overload are indicators of the incoming traffic and system load. If the backends get overloaded, requests pile up in the queues. When the queue is full, the system responds with backpressure errors. This can cause performance degradation.
If your cluster generates this alert, you may need to rate limit your queries. Look at optimizing the application generating the requests in the following ways:
- Examine the application retry logic, and reduce total retry count.
- Increase client request timeout at the driver layer.
- Reduce query parallelism.
- If needed, set the driver execution to "sync" rather than "async" to serialize queries.
If your cluster generates this alert but isn’t under a very large workload, contact Yugabyte Support.
Billing alerts
Billing alerts trigger for the following events:
| Alert | Response |
|---|---|
| Credit card expiring within 3 months | Add a new credit card. |
| Invoice payment failure | Check with your card issuer to ensure that your card is still valid and has not exceeded its limit. Alternatively, you can add another credit card to your billing profile. |
| Credit point usage exceeds the 50%, 75%, and 90% limit | Add a credit card to your billing profile, or contact Yugabyte Support. |
For information on adding credit cards and managing your billing profile, refer to Manage your billing profile and payment method.