Prometheus Integration
You can monitor your local YugabyteDB cluster with a local instance of Prometheus, a popular standard for time-series monitoring of cloud native infrastructure. YugabyteDB services and APIs expose metrics in the Prometheus format at the /prometheus-metrics endpoint. For details on the metrics targets for YugabyteDB, see Prometheus monitoring.
This tutorial uses the yugabyted local cluster management utility.
1. Create universe
Start a new local universe with replication factor of 3.
$ docker network create -d bridge yb-net
$ docker run -d --name yugabyte-node1 \
  --network yb-net \
  -p 127.0.0.1:7000:7000 \
  -p 127.0.0.1:9000:9000 \
  -p 127.0.0.1:5433:5433 \
  -p 127.0.0.1:9042:9042 \
  -p 127.0.0.1:6379:6379 \
  yugabytedb/yugabyte:latest bin/yugabyted start --daemon=false --listen=yugabyte-node1 --tserver_flags="start_redis_proxy=true"
$ docker run -d --name yugabyte-node2 \
  --network yb-net \
  -p 127.0.0.2:7000:7000 \
  -p 127.0.0.2:9000:9000 \
  -p 127.0.0.2:5433:5433 \
  -p 127.0.0.2:9042:9042 \
  -p 127.0.0.2:6379:6379 \
  yugabytedb/yugabyte:latest bin/yugabyted start --daemon=false --listen=yugabyte-node2 --join=yugabyte-node1 --tserver_flags="start_redis_proxy=true"
$ docker run -d --name yugabyte-node3 \
  --network yb-net \
  -p 127.0.0.3:7000:7000 \
  -p 127.0.0.3:9000:9000 \
  -p 127.0.0.3:5433:5433 \
  -p 127.0.0.3:9042:9042 \
  -p 127.0.0.3:6379:6379 \
  yugabytedb/yugabyte:latest bin/yugabyted start --daemon=false --listen=yugabyte-node3 --join=yugabyte-node1 --tserver_flags="start_redis_proxy=true"
2. Run the YugabyteDB workload generator
Pull the yb-sample-apps Docker container image. This container image has built-in Java client programs for various workloads including SQL inserts and updates.
$ docker pull yugabytedb/yb-sample-apps
Run the CassandraKeyValue workload application in a separate shell.
$ docker run --name yb-sample-apps --hostname yb-sample-apps --net yb-net yugabytedb/yb-sample-apps \
    --workload CassandraKeyValue \
    --nodes yugabyte-node1:9042 \
    --num_threads_write 1 \
    --num_threads_read 4
3. Prepare Prometheus configuration file
Copy the following into a file called yugabytedb.yml. Move this file to the /tmp directory so that you can bind the file to the Prometheus container later on.
global:
  scrape_interval:     5s # Set the scrape interval to every 5 seconds. Default is every 1 minute.
  evaluation_interval: 5s # Evaluate rules every 5 seconds. The default is every 1 minute.
  # scrape_timeout is set to the global default (10s).

# YugabyteDB configuration to scrape Prometheus time-series metrics
scrape_configs:
  - job_name: "yugabytedb"
    metrics_path: /prometheus-metrics
    relabel_configs:
      - target_label: "node_prefix"
        replacement: "cluster-1"
    metric_relabel_configs:
      # Save the name of the metric so we can group_by since we cannot by __name__ directly...
      - source_labels: ["__name__"]
        regex: "(.*)"
        target_label: "saved_name"
        replacement: "$1"
      # The following basically retrofit the handler_latency_* metrics to label format.
      - source_labels: ["__name__"]
        regex: "handler_latency_(yb_[^_]*)_([^_]*)_([^_]*)(.*)"
        target_label: "server_type"
        replacement: "$1"
      - source_labels: ["__name__"]
        regex: "handler_latency_(yb_[^_]*)_([^_]*)_([^_]*)(.*)"
        target_label: "service_type"
        replacement: "$2"
      - source_labels: ["__name__"]
        regex: "handler_latency_(yb_[^_]*)_([^_]*)_([^_]*)(_sum|_count)?"
        target_label: "service_method"
        replacement: "$3"
      - source_labels: ["__name__"]
        regex: "handler_latency_(yb_[^_]*)_([^_]*)_([^_]*)(_sum|_count)?"
        target_label: "__name__"
        replacement: "rpc_latency$4"

    static_configs:
      - targets: ["yugabyte-node1:7000", "yugabyte-node2:7000", "yugabyte-node3:7000"]
        labels:
          export_type: "master_export"

      - targets: ["yugabyte-node1:9000", "yugabyte-node2:9000", "yugabyte-node3:9000"]
        labels:
          export_type: "tserver_export"

      - targets: ["yugabyte-node1:12000", "yugabyte-node2:12000", "yugabyte-node3:12000"]
        labels:
          export_type: "cql_export"

      - targets: ["yugabyte-node1:13000", "yugabyte-node2:13000", "yugabyte-node3:13000"]
        labels:
          export_type: "ysql_export"

      - targets: ["yugabyte-node1:11000", "yugabyte-node2:11000", "yugabyte-node3:11000"]
        labels:
          export_type: "redis_export"
4. Start Prometheus server
Start the Prometheus server as below. The prom/prometheus container image will be pulled from the Docker registry if not already present on the localhost.
$ docker run \
    -p 9090:9090 \
    -v /tmp/yugabytedb.yml:/etc/prometheus/prometheus.yml \
    --net yb-net \
    prom/prometheus
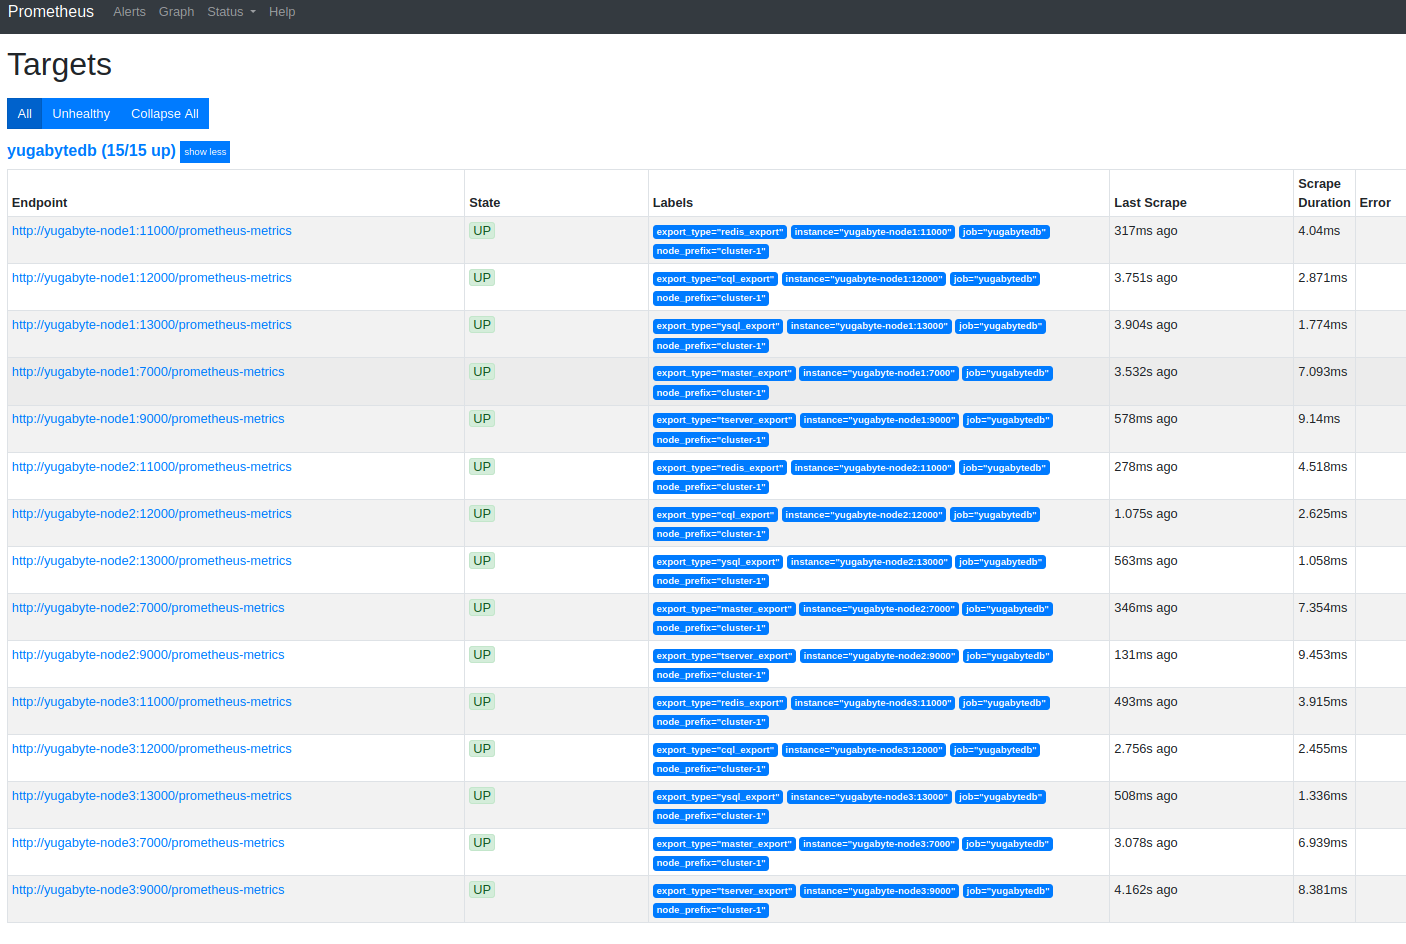
Open the Prometheus UI at http://localhost:9090 and then navigate to the Targets page under Status.
5. Analyze key metrics
On the Prometheus Graph UI, you can now plot the read/write throughput and latency for the CassandraKeyValue sample app. As you can see from the source code of the app, it uses only SELECT statements for reads and INSERT statements for writes (aside from the initial CREATE TABLE). This means you can measure throughput and latency by simply using the metrics corresponding to the SELECT and INSERT statements.
Paste the following expressions into the Expression box and click Execute followed by Add Graph.
Throughput
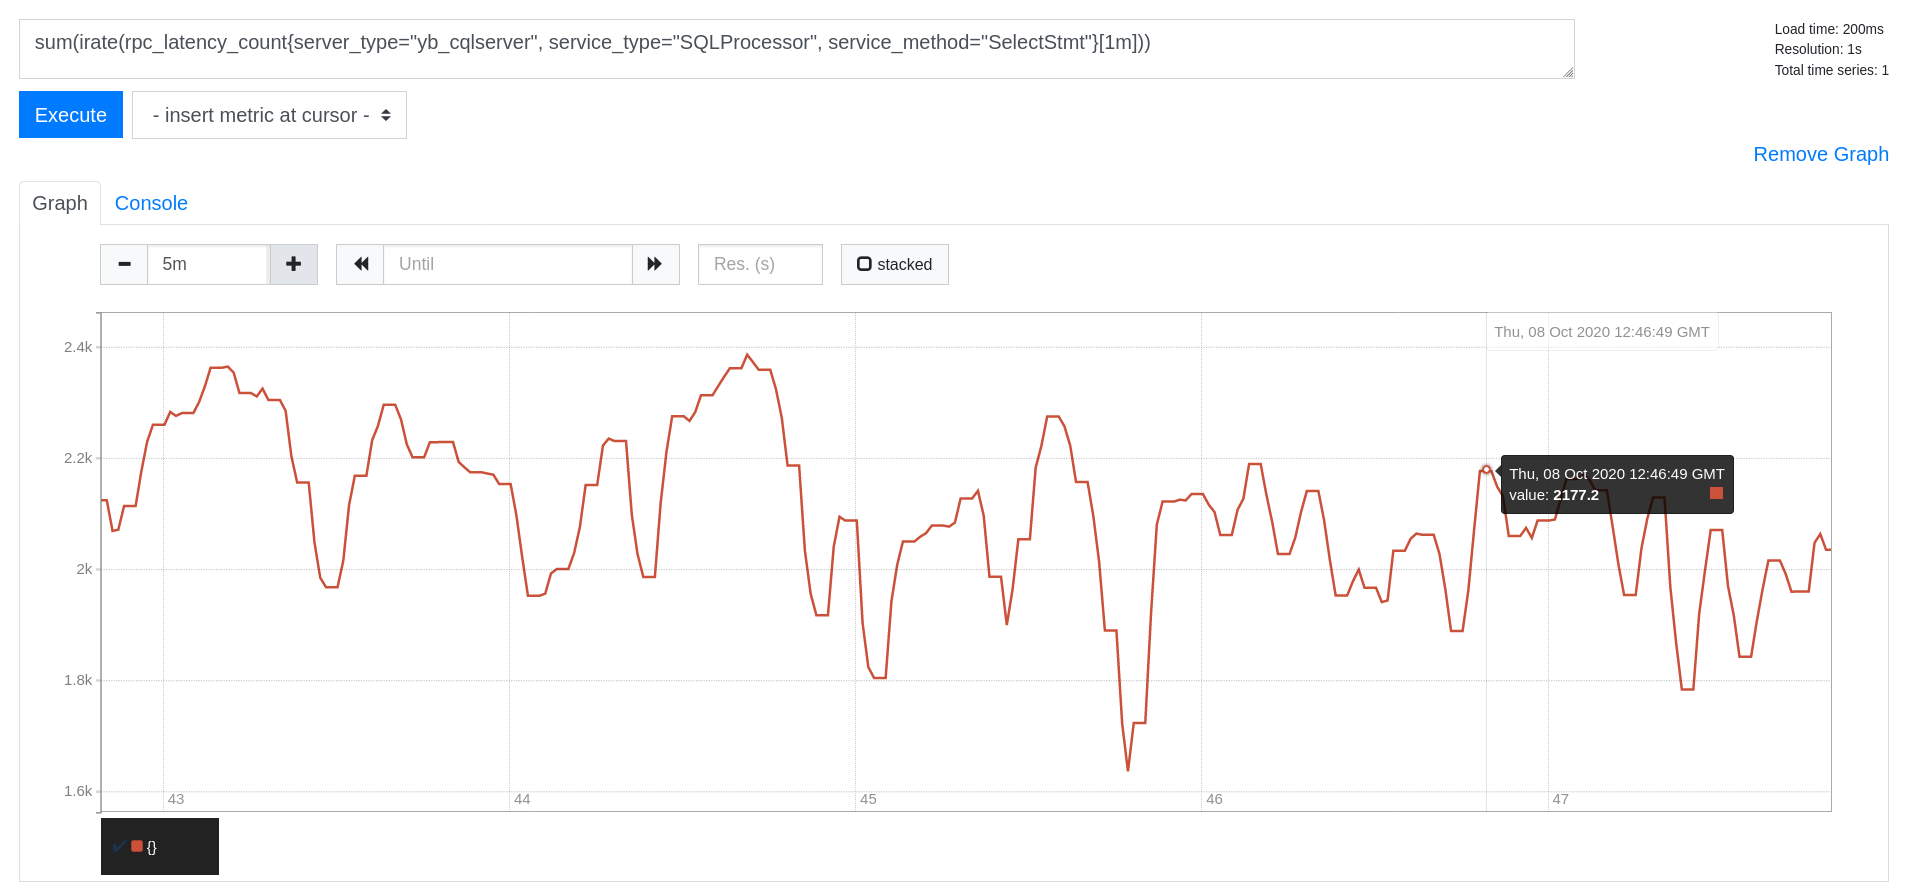
Read IOPS
sum(irate(rpc_latency_count{server_type="yb_cqlserver", service_type="SQLProcessor", service_method="SelectStmt"}[1m]))
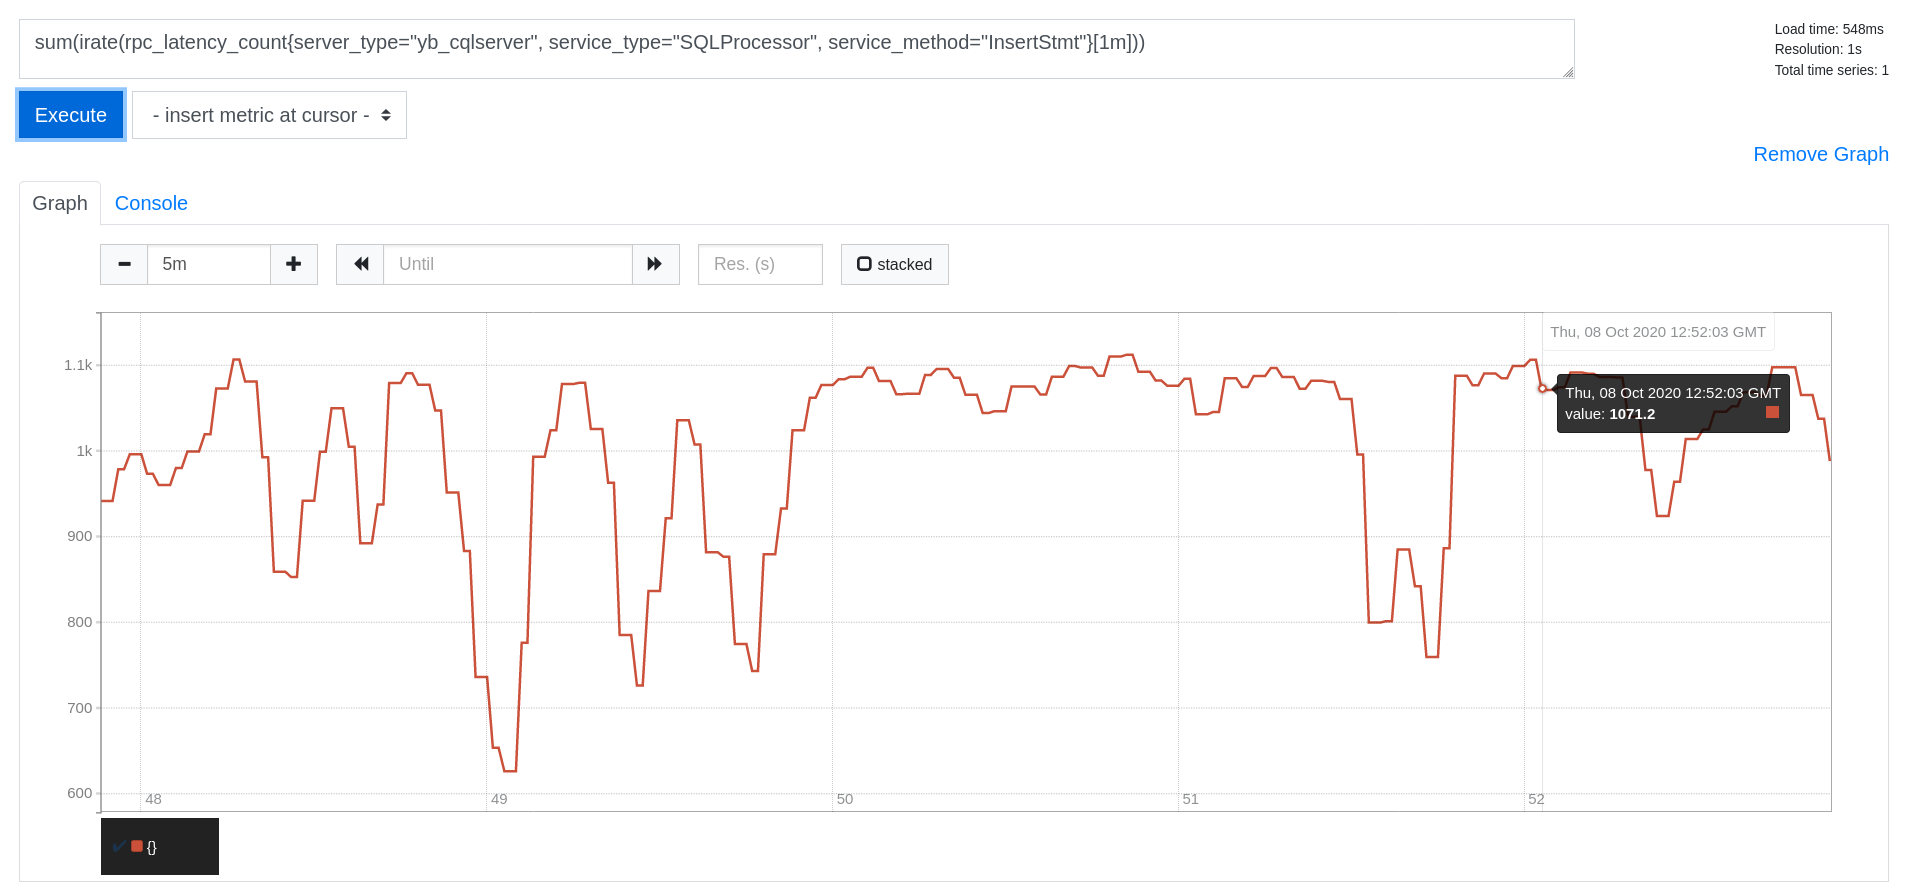
Write IOPS
sum(irate(rpc_latency_count{server_type="yb_cqlserver", service_type="SQLProcessor", service_method="InsertStmt"}[1m]))
Latency
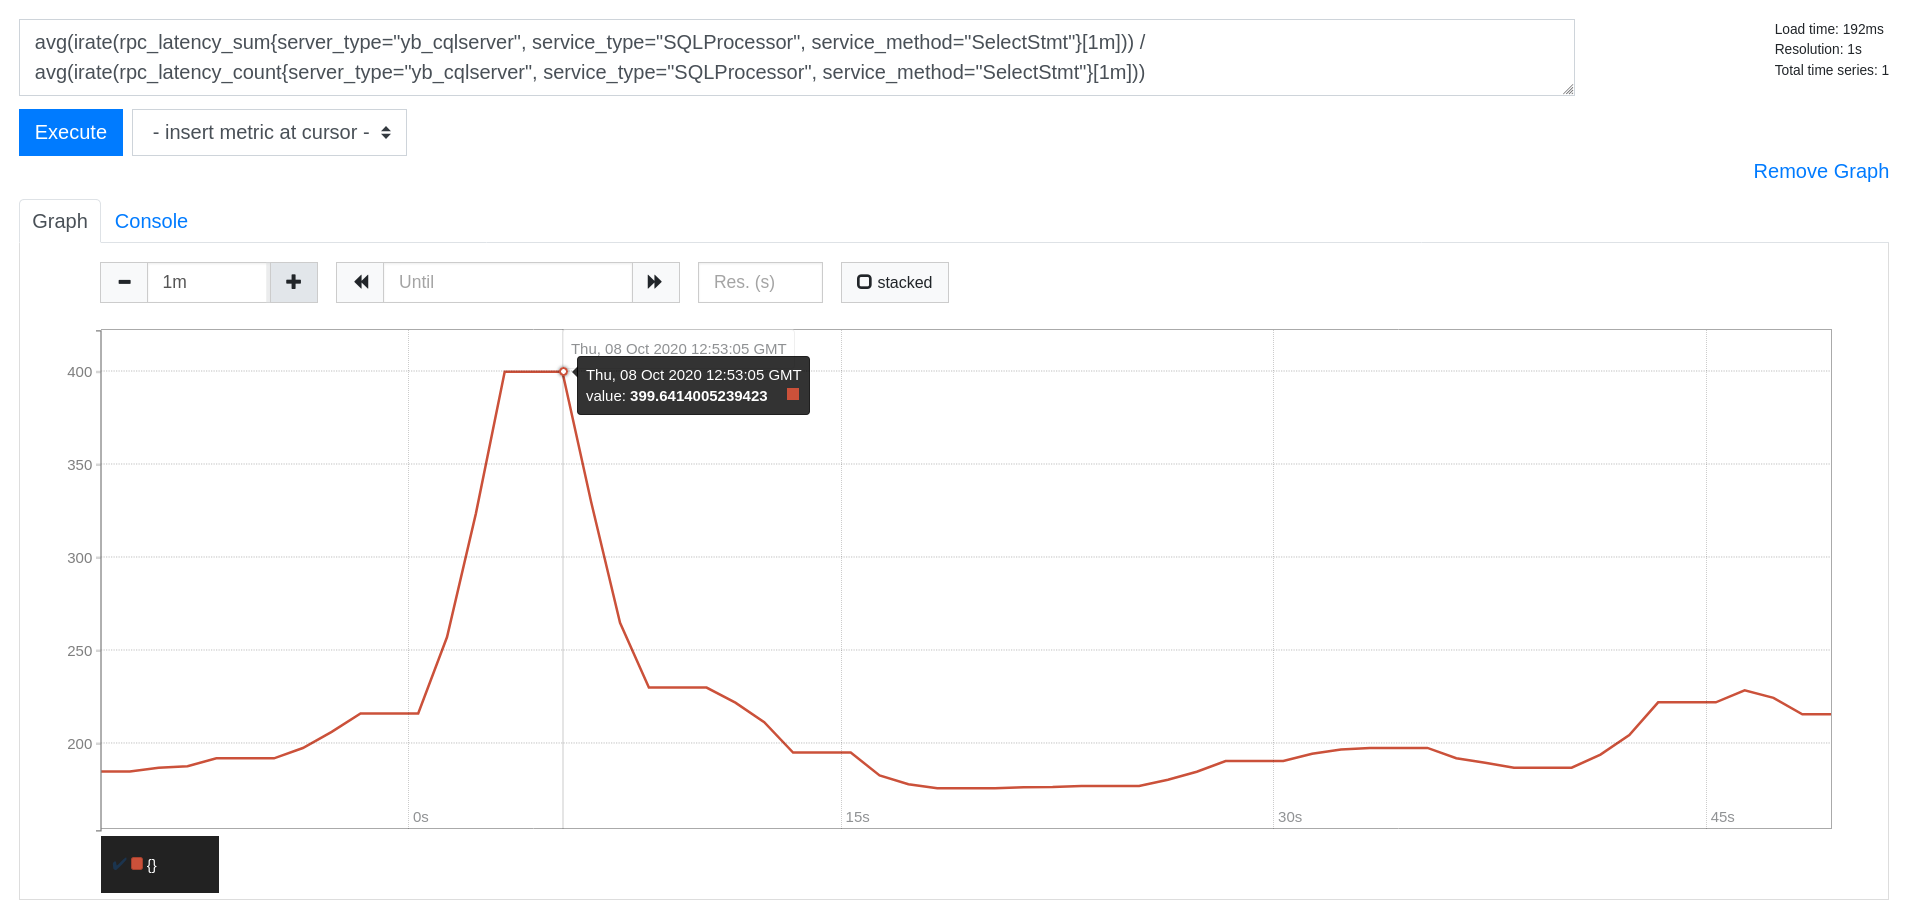
Read Latency (in microseconds)
avg(irate(rpc_latency_sum{server_type="yb_cqlserver", service_type="SQLProcessor", service_method="SelectStmt"}[1m])) /
avg(irate(rpc_latency_count{server_type="yb_cqlserver", service_type="SQLProcessor", service_method="SelectStmt"}[1m]))
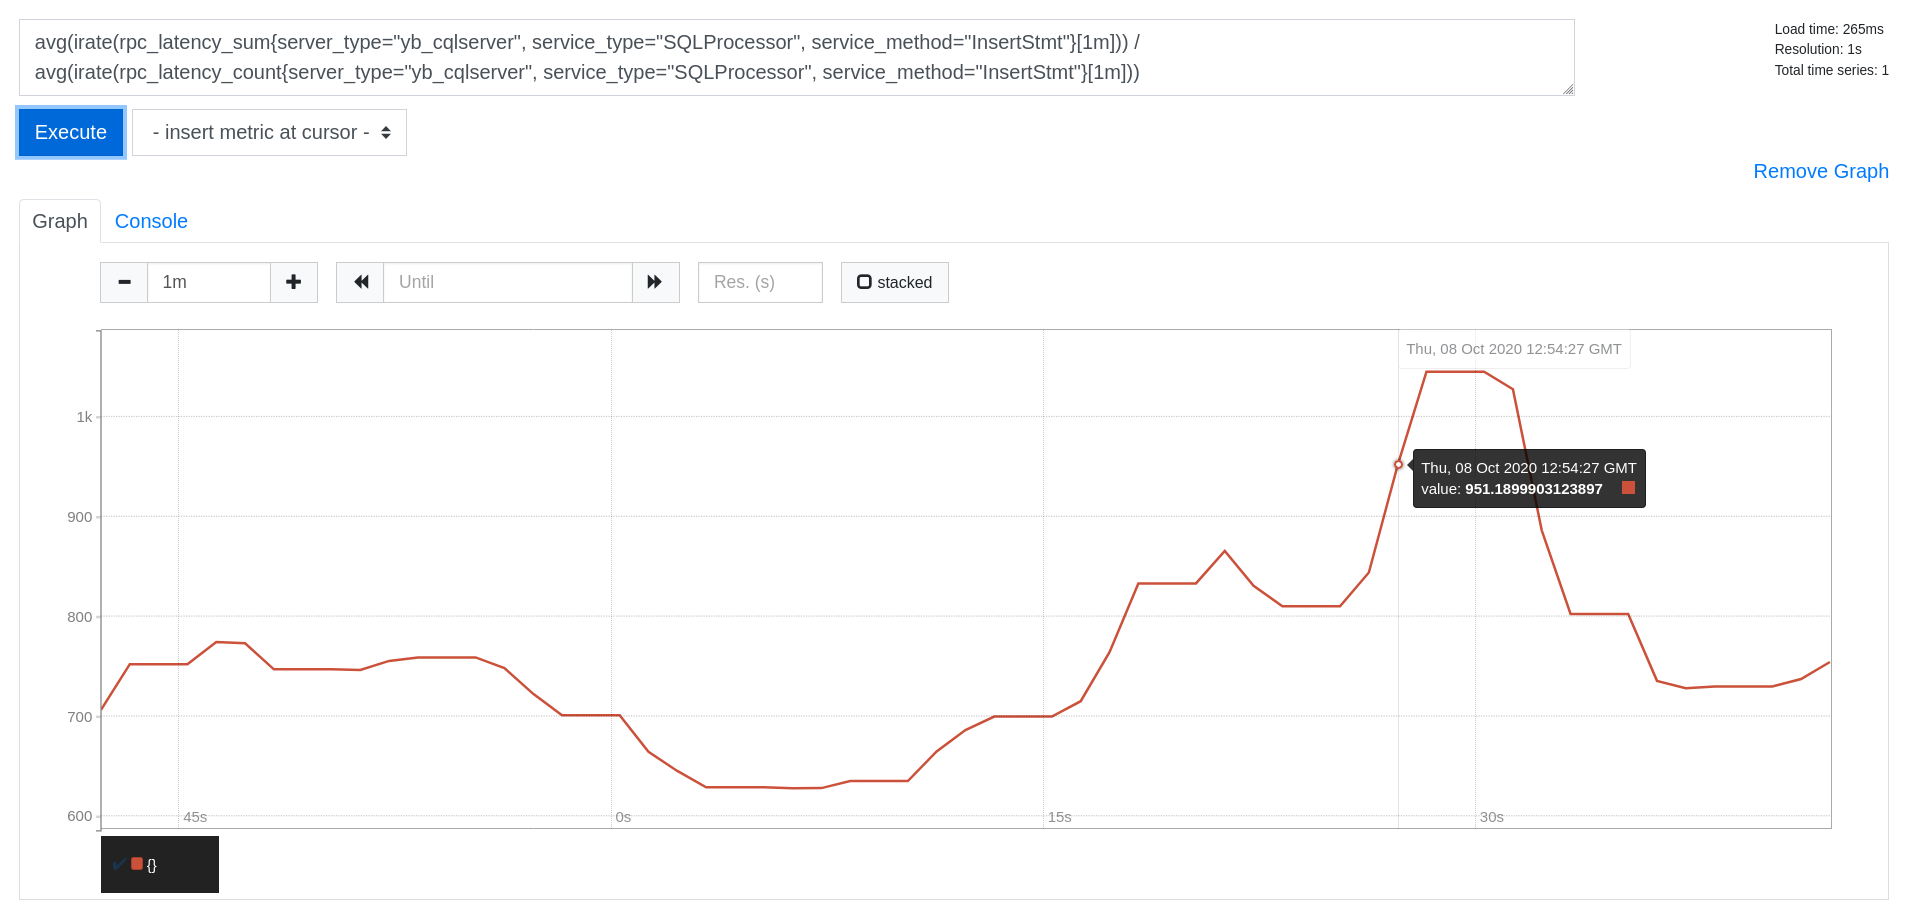
Write Latency (in microseconds)
avg(irate(rpc_latency_sum{server_type="yb_cqlserver", service_type="SQLProcessor", service_method="InsertStmt"}[1m])) /
avg(irate(rpc_latency_count{server_type="yb_cqlserver", service_type="SQLProcessor", service_method="InsertStmt"}[1m]))
6. Clean up (optional)
Optionally, you can shut down the local cluster created in Step 1.
$ docker stop yugabyte-node1 yugabyte-node2 yugabyte-node3
$ docker rm yugabyte-node1 yugabyte-node2 yugabyte-node3
$ docker network remove yb-net
What's next?
You can setup Grafana and import the YugabyteDB dashboard for better visualization of the metrics being collected by Prometheus.